Bitcoin Price Consolidates Below $35K – Here’s What Could Trigger Bearish Reaction
Bitcoin price attempted a fresh increase above the $34,500. BTC could start a major downside correction if there is a close below the 100 hourly SMA. Bitcoin is still struggling to clear the $35,000 resistance. The price...
Archive context
Older archive item. Useful for background and entity history, but not a fresh market-moving signal.

Bitcoin price attempted a fresh increase above the $34,500. BTC could start a major downside correction if there is a close below the 100 hourly SMA.
- Bitcoin is still struggling to clear the $35,000 resistance.
- The price is trading above $34,200 and the 100 hourly Simple moving average.
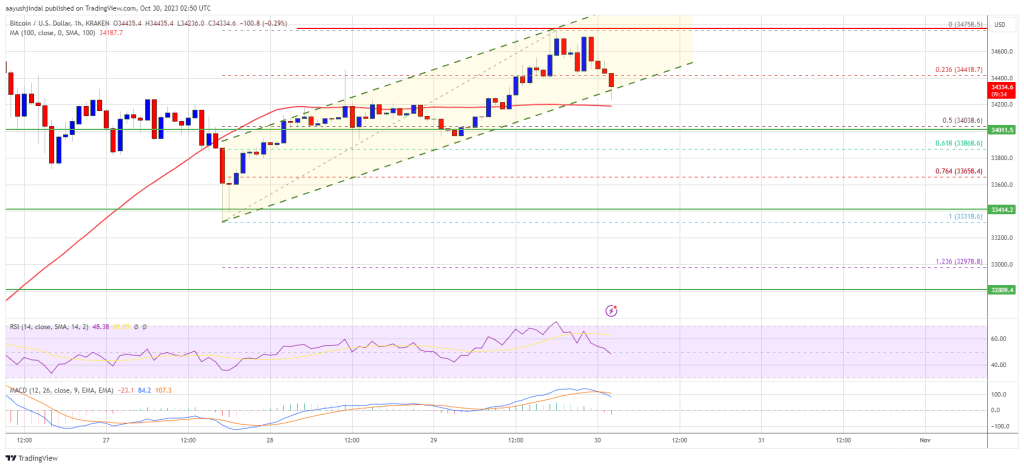
- There is a key rising channel forming with support near $34,300 on the hourly chart of the BTC/USD pair (data feed from Kraken).
- The pair could decline sharply if there is a close below $34,000 and then $33,400.
Bitcoin price started another increase above the $34,200 resistance zone. BTC climbed higher toward the $35,000 resistance zone, but there was lack of momentum.
The price traded as high as $34,758 and struggled to continue higher. It is now correcting gains below the $34,500 level. There was a move below the 23.6% Fib retracement level of the upward move from the $33,318 swing low to the $34,758 high.
Bitcoin is now trading above $34,200 and the 100 hourly Simple moving average. There is also a key rising channel forming with support near $34,300 on the hourly chart of the BTC/USD pair.
On the upside, immediate resistance is near the $34,500 level. The next key resistance could be near $34,750 or the channel upper trend line. The main resistance is still near the $35,000 zone. A clear move above the $35,000 resistance might start another steady increase.
Source: BTCUSD on TradingView.com
The next key resistance could be $35,500, above which the price could test $36,200. Any more gains might send BTC toward the $36,500 level in the near term.
Downside Correction In BTC?If Bitcoin fails to rise above the $34,750 resistance zone, it could start another decline. Immediate support on the downside is near the $34,200 level and the 100 hourly Simple moving average.
The next major support is near the $34,000 level or the 50% Fib retracement level of the upward move from the $33,318 swing low to the $34,758 high. If there is a move below $34,000, there is a risk of more downsides. In the stated case, the price could decline toward the $33,400 level or even $32,500.
Technical indicators:
Hourly MACD – The MACD is now losing pace in the bullish zone.
Hourly RSI (Relative Strength Index) – The RSI for BTC/USD is now below the 50 level.
Major Support Levels – $34,200, followed by $34,000.
Major Resistance Levels – $34,500, $34,750, and $35,000.
Why this matters
This bitcoin story adds another data point to the current market tape and is useful when read alongside nearby source coverage.
Original source
Read on NewsBTCRelated market context

Bitcoin (BTC) Price Prediction: $65K Remains Key Resistance as 4-Year Cycle Model Signals Make-or-Break Moment
The Bitcoin price today remains around $62,600-$62,900, according to TradingView data, reflecting a market that has stabilized fol...

Litecoin (LTC) Price Prediction: Mixed Technical Signals and Growing Hashrate Keep Traders Focused on $39 Support and $46 Breakout
Analysts are closely watching whether the Litecoin price can maintain support around $39 and break above the key $46 resistance le...

Ethereum Price Prediction: Hoskinson Accuses ETH of Taking Cardano Ideas Without Credit
Ethereum price has slipped as fresh ecosystem drama landed, which may bring its prediction down. All the while, buyers tried to de...

Cardano’s wallet hack exposed the user layer holding its on-chain government together
EMURGO said it is stepping down from its role in Pentad, the five-member group coordinating Cardano's infrastructure funding, to f...

Micron stock surges nearly 200% in 2026 as AI memory demand meets tokenized trading on Ethereum and Solana
Micron's stock surge highlights the transformative impact of AI and blockchain on traditional finance, with potential risks from m...

Bitcoin Price Prediction: Overlooked BTC Gold Ratio Is Flashing an Unexpected Signal
Bitcoin is hovering around $62,000, but the mood feels far less comfortable than the chart suggests. Bitcoin price prediction deba...