Bitcoin Price Consolidates In Key Range, What Could Trigger Next Move
Bitcoin price is still facing resistance below $17,000. BTC could decline heavily if there is a clear move below the $16,000 support zone. Bitcoin is still showing bearish signs below the $16,800 and $17,000 resistance l...
Archive context
Older archive item. Useful for background and entity history, but not a fresh market-moving signal.

Bitcoin price is still facing resistance below $17,000. BTC could decline heavily if there is a clear move below the $16,000 support zone.
- Bitcoin is still showing bearish signs below the $16,800 and $17,000 resistance levels.
- The price is trading above $16,500 and the 100 hourly simple moving average.
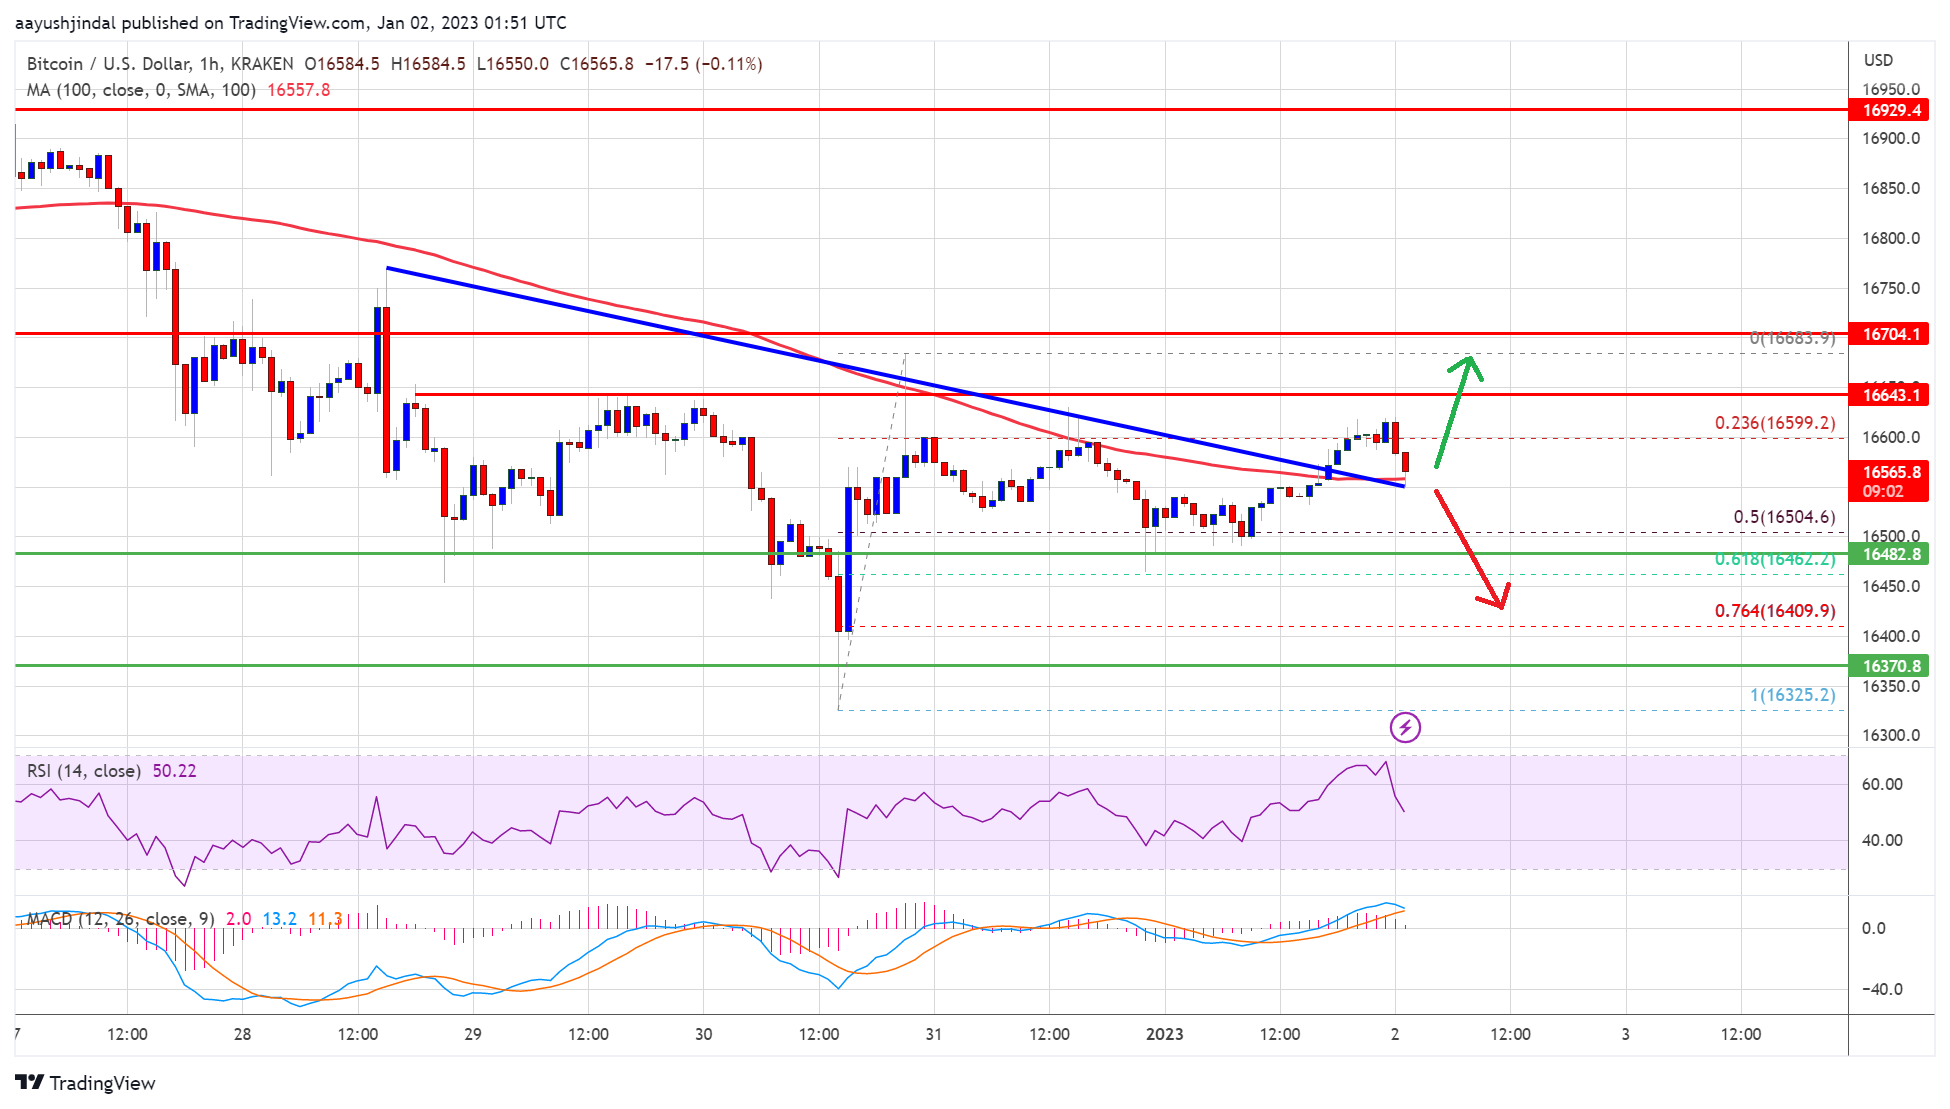
- There was a break above a key bearish trend line with resistance near $16,550 on the hourly chart of the BTC/USD pair (data feed from Kraken).
- The pair could resume its decline if there is a clear move below the $16,000 support.
Bitcoin price spiked below the $16,500 support zone. However, BTC bulls were active above the $16,200 level. The price traded as low as $16,325 and recently started an upside correction.
There was a minor recovery wave above the $16,500 level. The price climbed above the $16,600 level and the 100 hourly simple moving average. However, the bears were active near the $16,680 zone. A high was formed near $16,683 and the price corrected lower.
Bitcoin price declined below 23.6% Fib retracement level of the upward move from the $16,325 low to $16,683 high. It found support near the $16,500 level.
The price is trading above the 50% Fib retracement level of the upward move from the $16,325 low to $16,683 high. It is also above $16,500 and the 100 hourly simple moving average. On the upside, an immediate resistance is near the $16,600 level.
Source: BTCUSD on TradingView.com
The first major resistance is near the $16,680 zone. The next major resistance is near the $16,800 level. The key breakout zone is still near the $17,000 level. A clear move above the $17,000 resistance might start a fresh increase in the near term.
Fresh Decline in BTC?If bitcoin fails to start a recovery wave above the $16,650 resistance, it could start another decline. An immediate support on the downside is near the $16,500 level.
The next major support is near the $16,350 level. A clear move below the $16,350 support might spark a move towards the $16,000 level. Any more losses might send the price towards $15,500.
Technical indicators:
Hourly MACD – The MACD is now losing pace in the bullish zone.
Hourly RSI (Relative Strength Index) – The RSI for BTC/USD is now near the 50 level.
Major Support Levels – $16,500, followed by $16,350.
Major Resistance Levels – $16,600, $16,800 and $17,000.
Why this matters
This bitcoin story adds another data point to the current market tape and is useful when read alongside nearby source coverage.
Original source
Read on NewsBTCRelated market context

Ethereum (ETH) Price Prediction: ETH Eyes $2,100 as ETF Inflows Return and Whale Demand Builds
Ethereum price is trading near $1,785 after a modest 24-hour recovery, but the market is now watching whether fresh inflows and wh...

Ethereum Price Prediction: Robinhood Chain Leads Ethereum’s Biggest User Onboarding Wave
Price prediction debates are heating up as Ethereum trades at $1,790 and is slipping in trading volume. Still, Robinhood Chain kee...

Google Gemini AI Predicts Shocking Bitcoin Price by End of 2026
Google Gemini AI just framed Bitcoin current price position as a coiled spring rather than a broken asset. The model predicts $120...

Microsoft Copilot AI Predicts Insane XRP Price by End Of 2026
Microsoft Copilot AI just dropped one of the most updated rich XRP price predictions in this series, pulling in a July 2026 data p...

Bitcoin Price Jumps Above $64,000 as Cooler-Than-Expected Inflation Strengthens the Case for Rate Cuts
Bitcoin Magazine Bitcoin Price Jumps Above $64,000 as Cooler-Than-Expected Inflation Strengthens the Case for Rate Cuts Bitcoin pr...

XRP Price Prediction: Key Metrics Point to a Crash
XRP prediction chatter is heating up even as the price slips, which is usually when markets like to play tricks. XRP trades at aro...