Bitcoin Price Consolidates: Is Another Pump on the Horizon?
Bitcoin price remained below the $68,500 resistance zone. BTC is consolidating its gains and might aim for a fresh upward move in the near term. Bitcoin started a consolidation phase below the $68,500 resistance zone. Th...
Archive context
Older archive item. Useful for background and entity history, but not a fresh market-moving signal.

Bitcoin price remained below the $68,500 resistance zone. BTC is consolidating its gains and might aim for a fresh upward move in the near term.
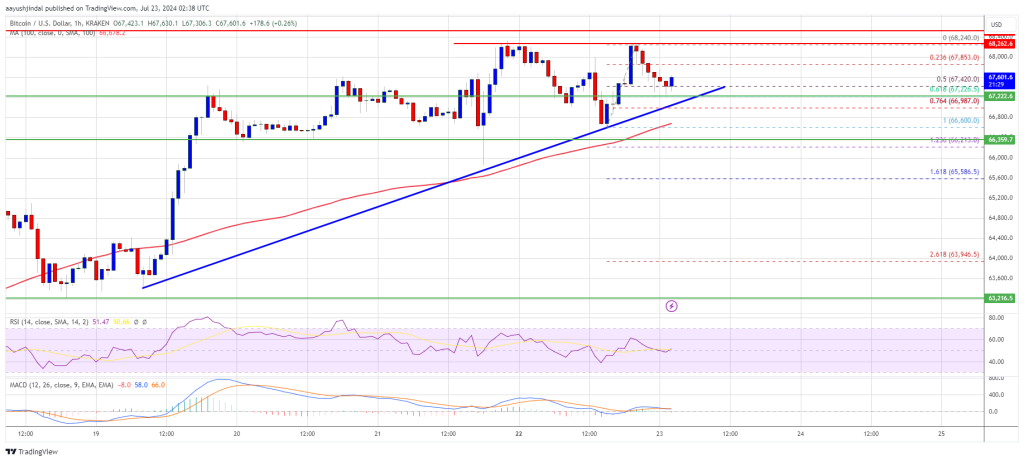
- Bitcoin started a consolidation phase below the $68,500 resistance zone.
- The price is trading above $66,800 and the 100 hourly Simple moving average.
- There is a key bullish trend line forming with support at $62,200 on the hourly chart of the BTC/USD pair (data feed from Kraken).
- The pair might extend gains and trade above the $68,500 resistance zone.
Bitcoin price extended its increase above the $66,500 and $67,000 resistance levels. BTC even spiked above the $68,000 level before the bears appeared. It seems like the bears are active near the $68,500 level.
The recent high was formed near $68,240 and the price is slowly moving lower. There was a move below the $67,500 level. The price dipped below the 50% Fib retracement level of the upward move from the $66,600 swing low to the $68,240 high.
Bitcoin price is now trading above $66,800 and the 100 hourly Simple moving average. There is also a key bullish trend line forming with support at $62,200 on the hourly chart of the BTC/USD pair. The trend line is close to the 61.8% Fib retracement level of the upward move from the $66,600 swing low to the $68,240 high.
If there is a fresh increase, the price could face resistance near the $68,250 level. The first key resistance is near the $68,500 level. A clear move above the $68,500 resistance might spark another increase in the coming sessions.
The next key resistance could be $68,800. The next major hurdle sits at $69,200. A close above the $69,200 resistance might push the price further higher. In the stated case, the price could rise and test the $70,000 resistance.
Are Dips Supported In BTC?If Bitcoin fails to climb above the $68,250 resistance zone, it could start a downside correction. Immediate support on the downside is near the $67,200 level.
The first major support is $66,600. The next support is now near $66,000. Any more losses might send the price toward the $65,500 support zone in the near term.
Technical indicators:
Hourly MACD – The MACD is now losing pace in the bullish zone.
Hourly RSI (Relative Strength Index) – The RSI for BTC/USD is now above the 50 level.
Major Support Levels – $67,200, followed by $66,600.
Major Resistance Levels – $68,200, and $68,500.
Why this matters
This bitcoin story adds another data point to the current market tape and is useful when read alongside nearby source coverage.
Original source
Read on NewsBTCRelated market context

Bitcoin (BTC) Price Prediction: BTC Holds $63K Support—Can Rising Active Addresses Offset Bearish Technical Signals?
Although the BTC price has remained near a key support zone, recent chart signals and Strategy’s sale of a portion of its Bitcoin...

Vitalik Buterin Says Ethereum’s Next Major Upgrade Will Take Three to Four Years and Rival the Merge
Ethereum co-founder Vitalik Buterin says the network’s next major overhaul, an initiative researchers are calling “Lean Ethereum,”...

Ethereum Price Prediction: Vitalik Hints at 3-4 Years Long ETH Rebuild
Ethereum price is trading at $1,780 as Vitalik Buterin revealed the network’s biggest roadmap since the Merge, which somehow sends...

Bitcoin Price Prediction: Peter Brandt Might Dump BTC for Gold
Bitcoin is facing a test, and its price prediction is not helping. So far in 2026, BTC has fallen about 28%, while gold is down ju...

XRP Price Prediction: Volume and ETF Inflow Send Ripple Token Higher
XRP price pushed above the $1.14 resistance area after buyers stepped in with heavy volume and bullish prediction. The token climb...

Sui DeFi TVL Breaks $1 Billion As Move-Based Chains Fight For Liquidity
Sui has crossed the $1 billion total value locked mark on DeFiLlama, giving the Move-based network a clearer claim to serious DeFi...