Bitcoin Price Consolidates Losses, This Resistance Might Trigger Another Drop
Bitcoin price is consolidating losses below $28,200. BTC could start another decline unless there is a clear move above the $28,500 resistance. Bitcoin is consolidating losses and trading above the $27,000 support. The p...
Archive context
Older archive item. Useful for background and entity history, but not a fresh market-moving signal.

Bitcoin price is consolidating losses below $28,200. BTC could start another decline unless there is a clear move above the $28,500 resistance.
- Bitcoin is consolidating losses and trading above the $27,000 support.
- The price is trading below $28,200 and the 100 hourly Simple moving average.
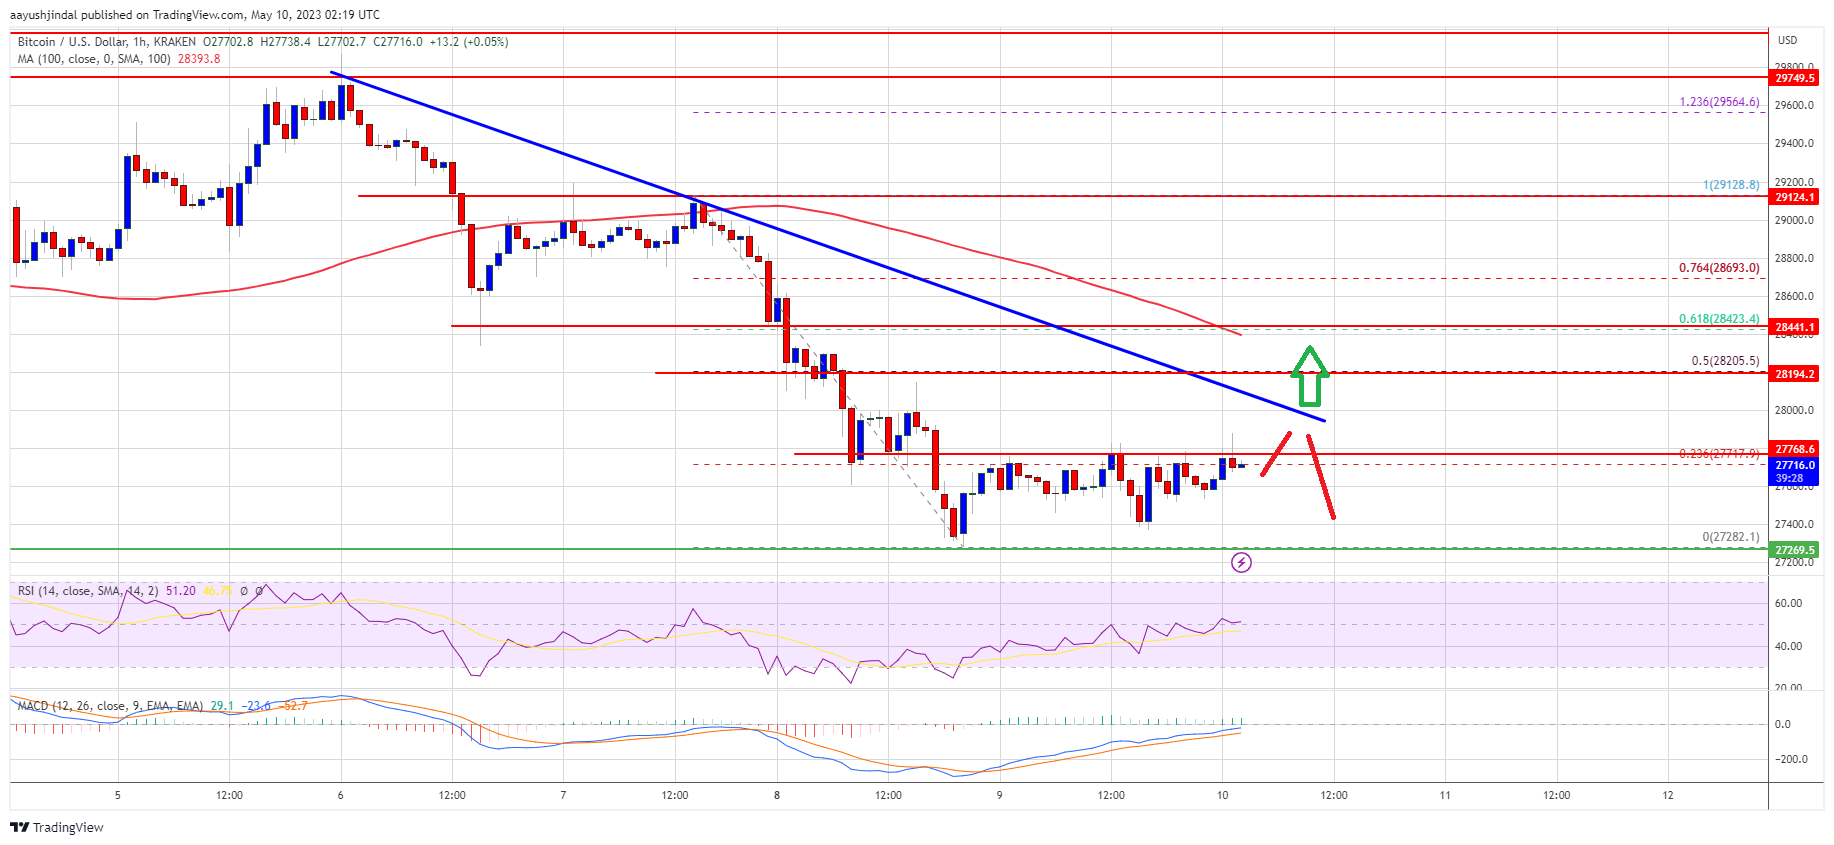
- There is a key bearish trend line forming with resistance near $28,040 on the hourly chart of the BTC/USD pair (data feed from Kraken).
- The pair could continue to move down if stays below $28,200 and $28,500.
Bitcoin price remained in a bearish zone below the $28,200 support zone. BTC tested the $27,200 support zone and now seems to be consolidating above the $27,400 level.
A low is formed near $27,282 and the price is now slowly moving higher. It is consolidating near the 23.6% Fib retracement level of the swing move from the $29,129 high to the $27,282 low. However, it is still trading below $28,200 and the 100 hourly Simple moving average.
Bitcoin price is now facing resistance near the $28,000 zone. Besides, there is a key bearish trend line forming with resistance near $28,040 on the hourly chart of the BTC/USD pair.
The next major resistance is near the $28,200 level or the 50% Fib retracement level of the swing move from the $29,129 high to the $27,282 low. The main resistance is now forming near the $28,500 level and the 100 hourly Simple moving average.
Source: BTCUSD on TradingView.com
A close above the $28,500 resistance might spark a decent increase. The next key resistance is near $29,125, above which the price might climb toward the $29,500 resistance. Any more gains could open the doors for a decent move toward the $30,000 resistance.
More Losses in BTC?If Bitcoin’s price fails to clear the $28,200 resistance, it could continue to move down. Immediate support on the downside is near the $27,250 level.
The next major support is near the $27,000 zone, below which the price might accelerate losses and drop to the $26,000 support zone. Any more losses might take Bitcoin toward the $25,500 level in the near term.
Technical indicators:
Hourly MACD – The MACD is now losing pace in the bearish zone.
Hourly RSI (Relative Strength Index) – The RSI for BTC/USD is now above the 50 level.
Major Support Levels – $27,250, followed by $27,000.
Major Resistance Levels – $28,050, $28,200, and $28,500.
Why this matters
This bitcoin story adds another data point to the current market tape and is useful when read alongside nearby source coverage.
Original source
Read on NewsBTCRelated market context

Is Cardano About to Take Over? ChatGPT AI Predicts a Huge Move
Something potentially massive could be brewing for Cardano (ADA) by January 1, 2027. Sam Altman’s ChatGPT AI predicts that, in an...

Claude AI Predicts a Huge Move for Bitcoin by 2027
Anthropic’s Claude AI predicts that Bitcoin (BTC) could stage a spectacular rally before January 1, 2027, if institutional demand,...
Bitcoin Price Prediction: Michael Saylor Says BTC Will Reach $100K in 12 Months as 4-Year Bull Run Begins
Speaking on the Schwab Network, Saylor said the cryptocurrency was entering a new bull market and predicted that the broader rally...

Grok AI Predicts Something Big Is Brewing for XRP by Jan 1, 2027
Elon Musk’s Grok AI predicts an incredible XRP price by the end of 2026. This isn’t a standard bullish outlook. It’s an extreme, o...

Bitcoin price resistance near $87K reinforced by late 2025 buyers, Glassnode says
Bitcoin's price struggles near $87K highlight the delicate balance between recent buyer resistance and institutional demand, impac...

Bitcoin (BTC) Price Prediction: BlackRock’s $663M ETF Inflow Reverses October Outflows—Can BTC Break the $90K Barrier?
The development offered a fresh bullish signal as Bitcoin traded within $81.185–$82,954, although questions remain about whether d...