Bitcoin Price Consolidates – Why 100 SMA Could Spark Fresh Increase
Bitcoin price failed again to clear the $38,500 resistance zone. BTC is consolidating above the 100 hourly SMA and might attempt another increase. Bitcoin is still facing heavy resistance near the $38,500 zone. The price...
Archive context
Older archive item. Useful for background and entity history, but not a fresh market-moving signal.

Bitcoin price failed again to clear the $38,500 resistance zone. BTC is consolidating above the 100 hourly SMA and might attempt another increase.
- Bitcoin is still facing heavy resistance near the $38,500 zone.
- The price is trading above $37,400 and the 100 hourly Simple moving average.
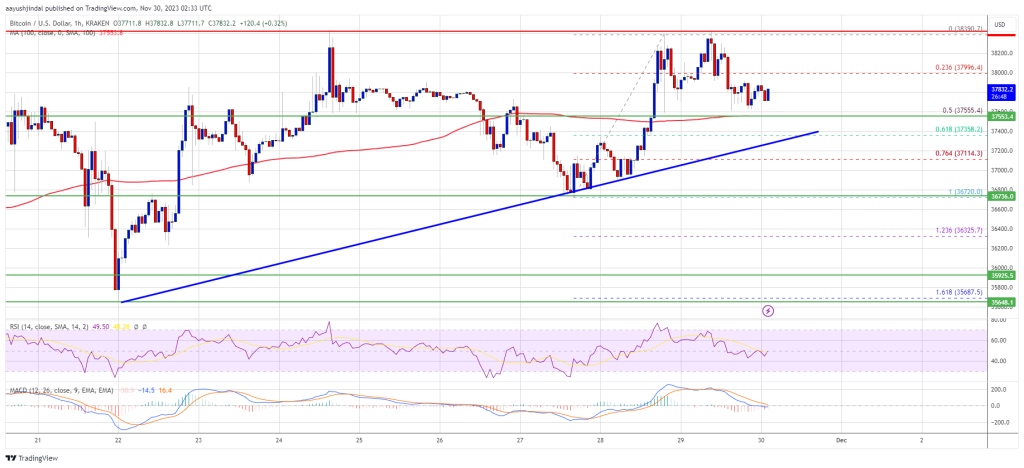
- There is a key bullish trend line forming with support near $37,350 on the hourly chart of the BTC/USD pair (data feed from Kraken).
- The pair could make another attempt to clear the $38,500 resistance unless it breaks below $37,350.
Bitcoin price remained well-bid above the $37,500 support zone. BTC climbed higher above the $38,000 level and made another attempt to clear the $38,400 resistance zone.
However, the bulls failed to gain strength and the price peaked near $38,400. It is again correcting gains and trading below the 23.6% Fib retracement level of the upward move from the $36,721 swing low to the $38,390 high.
Bitcoin is now trading above $37,400 and the 100 hourly Simple moving average. There is also a key bullish trend line forming with support near $37,350 on the hourly chart of the BTC/USD pair.
On the upside, immediate resistance is near the $38,200 level. The first major resistance is forming near $38,400. The main resistance is still near the $38,500 level. A close above the $38,500 resistance might start a fresh rally.
Source: BTCUSD on TradingView.com
The next key resistance could be near $39,200, above which BTC could climb toward the $39,500 level. Any more gains might send BTC toward the $40,000 resistance.
More Losses In BTC?If Bitcoin fails to rise above the $38,400 resistance zone, it could start another decline. Immediate support on the downside is near the $37,550 level or the 50% Fib retracement level of the upward move from the $36,721 swing low to the $38,390 high.
The next major support is near $37,350 and the trend line. If there is a move below $37,350, there is a risk of more downsides. In the stated case, the price could decline toward the $36,720 support in the near term.
Technical indicators:
Hourly MACD – The MACD is now losing pace in the bullish zone.
Hourly RSI (Relative Strength Index) – The RSI for BTC/USD is now near the 50 level.
Major Support Levels – $37,550, followed by $37,350.
Major Resistance Levels – $38,400, $38,500, and $39,200.
Why this matters
This bitcoin story adds another data point to the current market tape and is useful when read alongside nearby source coverage.
Original source
Read on NewsBTCRelated market context

Bitcoin (BTC) Price Prediction: $65K Remains Key Resistance as 4-Year Cycle Model Signals Make-or-Break Moment
The Bitcoin price today remains around $62,600-$62,900, according to TradingView data, reflecting a market that has stabilized fol...

Litecoin (LTC) Price Prediction: Mixed Technical Signals and Growing Hashrate Keep Traders Focused on $39 Support and $46 Breakout
Analysts are closely watching whether the Litecoin price can maintain support around $39 and break above the key $46 resistance le...

Crypto News, July 9: Iran Market Fears Fade as Bitcoin and Ethereum Price Shrug Off Another Panic
Fresh Iran headlines sent us scrambling last night, but the panic did not last. Markets, especially Bitcoin and Ethereum price, so...

US strikes hit Iranian military sites near Bushehr nuclear plant as crypto markets brace for volatility
Escalating US-Iran tensions could disrupt crypto mining and lead to stricter regulations, impacting global markets and investor st...

Micron stock surges nearly 200% in 2026 as AI memory demand meets tokenized trading on Ethereum and Solana
Micron's stock surge highlights the transformative impact of AI and blockchain on traditional finance, with potential risks from m...

Bitcoin Price Prediction: Overlooked BTC Gold Ratio Is Flashing an Unexpected Signal
Bitcoin is hovering around $62,000, but the mood feels far less comfortable than the chart suggests. Bitcoin price prediction deba...