Bitcoin Price Consolidates, Why 100 SMA Could Start A Decent Recovery
Bitcoin price remained stable above the $16,000 support zone. BTC could start a decent recovery wave if there is a clear move above the 100 hourly SMA. Bitcoin remained well bid above the $16,000 and $15,800 support leve...
Archive context
Older archive item. Useful for background and entity history, but not a fresh market-moving signal.

Bitcoin price remained stable above the $16,000 support zone. BTC could start a decent recovery wave if there is a clear move above the 100 hourly SMA.
- Bitcoin remained well bid above the $16,000 and $15,800 support levels.
- The price is trading below $17,000 and the 100 hourly simple moving average.
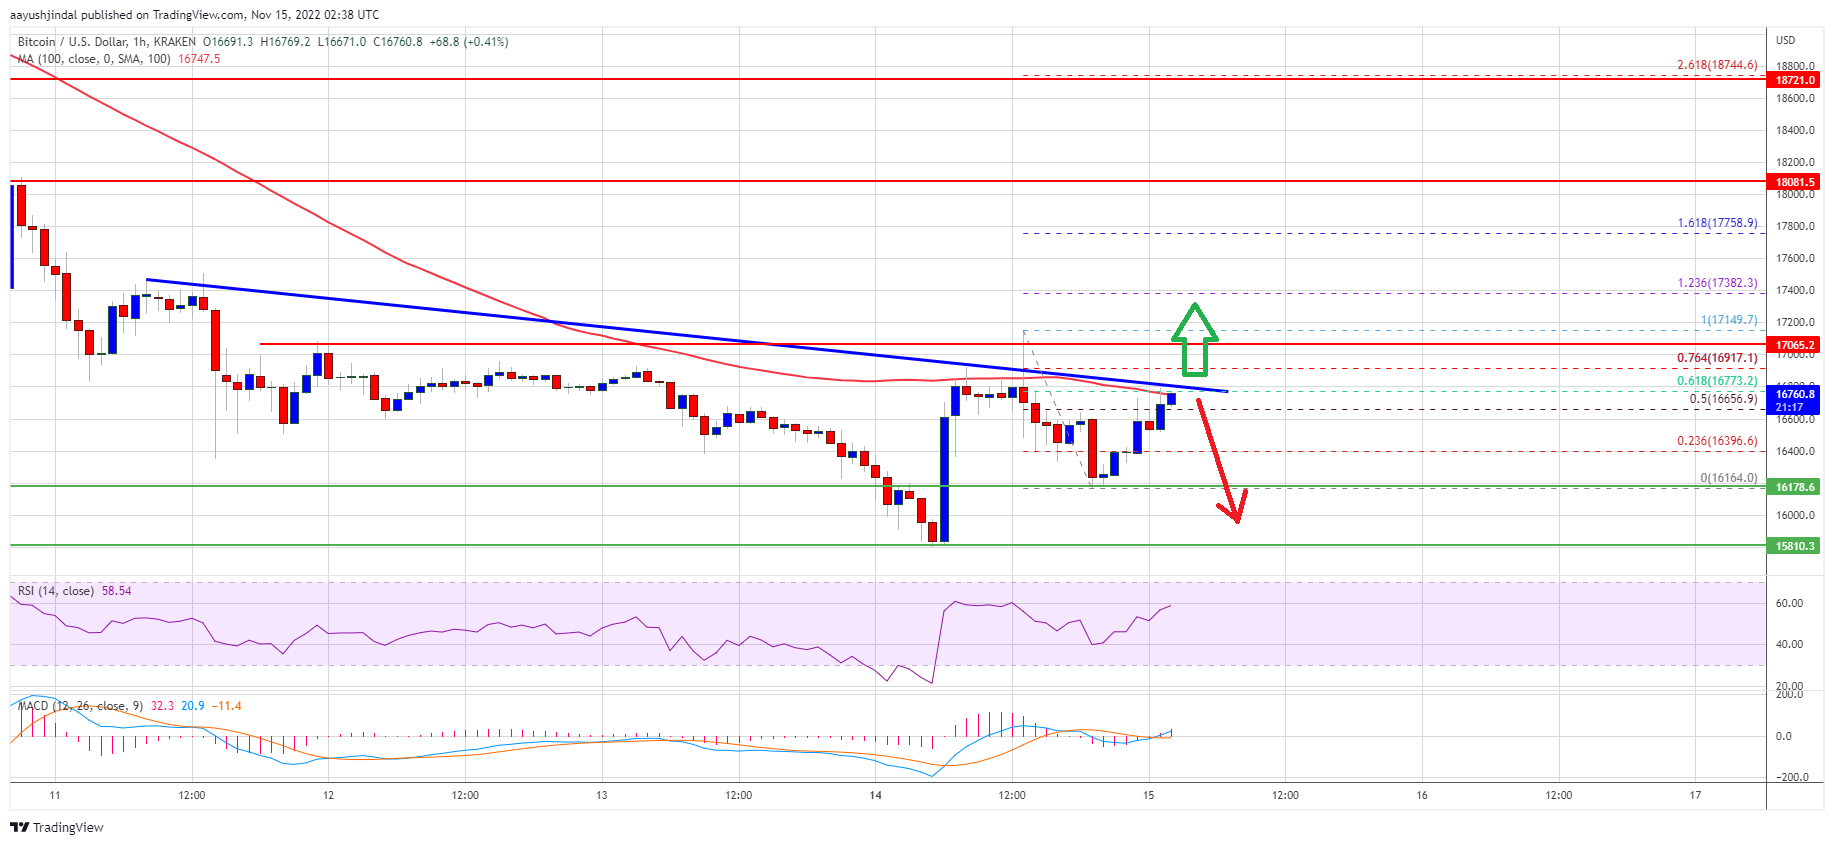
- There is a major bearish trend line forming with resistance near $16,800 on the hourly chart of the BTC/USD pair (data feed from Kraken).
- The pair could start a recovery wave if it clears the $17,000 resistance zone.
Bitcoin price reacted to the downside once again after it failed to clear the $17,200 zone. BTC declined below the $17,000 and $16,500 levels. It even spiked below the $16,200 level.
However, the bulls were active above the $16,000 support zone. A low was formed near $16,164 and the price started a slow increase. There was a move above the $16,400 and $16,500 levels. The price cleared the 50% Fib retracement level of the recent decline from the $17,149 swing high to $16,154 low.
Bitcoin price is now trading below $17,000 and the 100 hourly simple moving average. It is testing the 61.8% Fib retracement level of the recent decline from the $17,149 swing high to $16,154 low.
On the upside, an immediate resistance is near the $16,800 level. There is also a major bearish trend line forming with resistance near $16,800 on the hourly chart of the BTC/USD pair, and the 100 hourly simple moving average. A clear move above the $17,000 resistance might push the price further higher.
Source: BTCUSD on TradingView.com
The next major resistance is near $17,200, above which the price could test the $17,750 zone. Any more gains might send the price towards the $18,000 resistance zone.
Fresh Decline in BTC?If bitcoin fails to start a recovery wave above the $17,000 resistance zone, it could continue to move down. An immediate support on the downside is near the $16,400 level.
The next major support is near the $16,150 zone. A clear move below the $16,150 support might push the price further lower. In this case, the price may perhaps decline towards the $15,550 support zone.
Technical indicators:
Hourly MACD – The MACD is now gaining pace in the bullish zone.
Hourly RSI (Relative Strength Index) – The RSI for BTC/USD is now above the 50 level.
Major Support Levels – $16,150, followed by $15,550.
Major Resistance Levels – $16,800, $17,000 and $17,500.
Why this matters
This bitcoin story adds another data point to the current market tape and is useful when read alongside nearby source coverage.
Original source
Read on NewsBTCRelated market context

XRP’s $1 rebound faces holders trapped above $2
Glassnode reported that XRP holders who bought between 6 and 12 months ago have an average cost basis near $2.22, roughly 52% abov...

Bitcoin Price Prediction: Strategy Has a New BTC Approach
Bitcoin price is trading at $62,900, as we debate whether this pause is simply a reset or something more serious, with bearish pre...

Ethereum Price Prediction: Robinhood Chain Leads Ethereum’s Biggest User Onboarding Wave
Price prediction debates are heating up as Ethereum trades at $1,790 and is slipping in trading volume. Still, Robinhood Chain kee...

Bitcoin pushes toward $65,000 on US inflation relief that may already be fading
Bitcoin approached $65,000 on July 14 as a sharper-than-expected slowdown in US inflation weakened the case for another near-term...

XRP Price Prediction: Key Metrics Point to a Crash
XRP prediction chatter is heating up even as the price slips, which is usually when markets like to play tricks. XRP trades at aro...

Ethereum Research Thread Puts Sybil Resistance Back In Focus For Decentralized Networks
Ethereum Research Thread Puts Sybil Resistance Back In Focus For Decentralized Networks is a useful reminder that crypto coverage...