Bitcoin Price Could Extend Gains: Will Bulls Stay in Control?
Bitcoin price started a decent increase above the $55,500 resistance. BTC is consolidating and might aim for more gains if it clears the $58,000 resistance. Bitcoin is rising from the $52,500 support zone. The price is t...
Archive context
Older archive item. Useful for background and entity history, but not a fresh market-moving signal.

Bitcoin price started a decent increase above the $55,500 resistance. BTC is consolidating and might aim for more gains if it clears the $58,000 resistance.
- Bitcoin is rising from the $52,500 support zone.
- The price is trading above $55,500 and the 100 hourly Simple moving average.
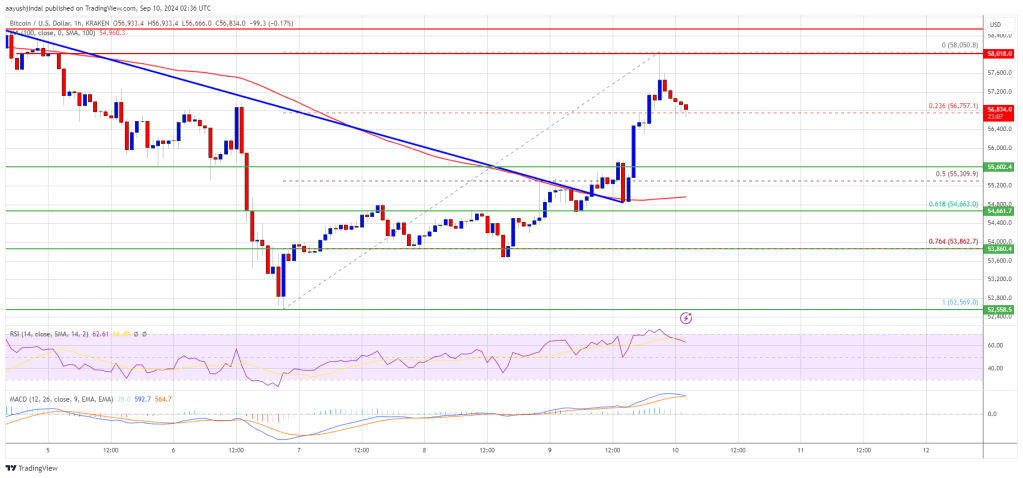
- There was a break above a key bearish trend line with resistance at $55,300 on the hourly chart of the BTC/USD pair (data feed from Kraken).
- The pair is facing resistance near the $58,000 and $58,200 resistance levels in the near term.
Bitcoin price started a decent increase after it broke the $55,500 resistance zone. BTC gained pace and was able to clear the $56,200 resistance. There was a break above a key bearish trend line with resistance at $55,300 on the hourly chart of the BTC/USD pair.
The pair even spiked above the $58,000 resistance zone. A high was formed at $58,050 and the price is now consolidating gains. There was a minor decline below the $57,500 level. The price dipped below the 23.6% Fib retracement level of the upward move from the $52,569 swing low to the $58,050 high.
Bitcoin is now trading above $55,500 and the 100 hourly Simple moving average. On the upside, the price could face resistance near the $57,500 level. The first key resistance is near the $58,000 level.
A clear move above the $58,000 resistance might send the price further higher in the coming sessions. The next key resistance could be $58,500. A close above the $58,500 resistance might spark more upsides. In the stated case, the price could rise and test the $60,000 resistance.
Another Decline In BTC?If Bitcoin fails to rise above the $58,000 resistance zone, it could start another decline. Immediate support on the downside is near the $56,750 level.
The first major support is $55,500 or the 50% Fib retracement level of the upward move from the $52,569 swing low to the $58,050 high. The next support is now near the $53,500 zone. Any more losses might send the price toward the $52,600 support in the near term.
Technical indicators:
Hourly MACD – The MACD is now losing pace in the bullish zone.
Hourly RSI (Relative Strength Index) – The RSI for BTC/USD is now above the 50 level.
Major Support Levels – $56,750, followed by $55,500.
Major Resistance Levels – $57,500, and $58,000.
Why this matters
This bitcoin story adds another data point to the current market tape and is useful when read alongside nearby source coverage.
Original source
Read on NewsBTCRelated market context

Solana Price Prediction: SOL Holds Near $81 as Breakout Setup Points to $87, but Whale Flows Keep Risk Active
Solana price is back in focus after a sharp recovery pushed SOL towards the $81 area. The move has improved short-term momentum, e...

Leading Claude AI Fable 5 Predicts Stunning XRP Price by The End of 2026
Anthropic’s new Claude AI model, Fable 5, predicts XRP price for the entire second half around a single event that could be resolv...

XRP vs Bitcoin: Investor Says RLUSD Growth and Regulatory Clarity Could Shift Crypto’s Balance of Power
While the claim remains highly ambitious given Bitcoin’s commanding lead in market capitalization, the discussion highlights broad...

Hyperliquid (HYPE) Price Prediction: Symmetrical Triangle Breakout Puts $77 Target Back in Focus
The breakout comes after several sessions of price compression, with HYPE continuing to trade within a broader technical structure...

Vitalik Buterin unveils “Lean Ethereum” roadmap for quantum resistance by 2029
Ethereum's proactive roadmap enhances its resilience and appeal, potentially boosting market confidence and investment in its futu...

Micron stock soars nearly 700% in a year as tokenized version trades on Ethereum via Ondo
Micron's stock surge and tokenization highlight the growing intersection of traditional finance and decentralized finance, impacti...