Bitcoin Price Could Still Crash To $99,000 If This Happens, Warns Ostium Labs
Ostium Research’s latest weekly note opened with Bitcoin under pressure after a swift selloff into the new week, describing “a mass liquidation event” that pushed price as low as $111,761, after rejection near resistance...
Archive context
Older archive item. Useful for background and entity history, but not a fresh market-moving signal.

Ostium Research’s latest weekly note opened with Bitcoin under pressure after a swift selloff into the new week, describing “a mass liquidation event” that pushed price as low as $111,761, after rejection near resistance in the mid-$117,000s.
The team frames the drawdown as part of a previously flagged “window of weakness… into early October,” while stressing the higher-timeframe uptrend remains intact unless key weekly levels fail. The report, published September 22, 2025, sets out both the technical map and the event calendar that could govern path-dependency over the next several sessions.
Bitcoin Crash To $99,000 LoomsOn the weekly chart, Ostium notes last week’s consolidation around the August open and a wick into “key resistance… at $117.5k,” followed by a close marginally below the open. Early-week price action then carried price beneath reclaimed support into the $111k handle, with the analysts highlighting “over $1.6bn in longs liquidated so far today.”
Two structural inflection zones anchor the bearish risk: “Acceptance below $107k on a weekly close would open up more downside into $99k,” whereas on the topside “the weekly high at $115.3k… is at least revisited some time later in the week.”
On the daily timeframe, the August open at $115.7k is the pivot the market must reclaim to reassert momentum. As the authors put it, “that August open at $115.7k [is] a key level to flip into support to resume bullishness.”
The immediate battleground is the prior all-time high at $112k, where “a reclaim of $112k as support” would tilt probabilities toward a higher low and force shorts to cover into a move back through $115.7k. Their base case, however, is for additional chop “between $112k-$115k before a second push lower below today’s low,” which will determine whether the market undercuts the June swing at $107k or marks out a bottom sooner.
Tactically, Ostium lays out both long and short triggers with unusual clarity. On the long side: “a sweep of today’s low early this week and then a reclaim of $112k as support,” riding momentum “back into the weekly high.” On the short side, they float what they call “a really nice short setup… a sharp v-reversal… back above the weekly high… before… rejecting and breaking back below $115.3k,” which would then target “$112k and lower.” In other words, a squeeze-then-fade path that punishes both late longs and late shorts.
Positioning and derivatives breadth round out the near-term blueprint. The note shares snapshots of 3-month annualized basis, Bitcoin versus altcoin open interest, and one-week/one-month liquidation maps, underscoring how quickly liquidity pockets can flip into magnets in thin conditions.
This informs their near-term expectation that “the next leg lower or second liquidation event this week [could] be a high probability low,” followed by a retest of $115.3k that will act as the tape’s verdict on whether another down-leg or a bear-trap reversal is in play into quarter-end.
The house view remains probabilistic rather than doctrinaire. If $107k fails on a weekly close, the weakness window could extend into “$99k”; if it holds—and especially if the market can “flip $115.7k into support”—the higher-low narrative stays alive. In the authors’ words, for Ethereum “nothing about this higher timeframe structure or momentum is currently giga-bearish,” and, by analogy, Bitcoin’s structure is best judged by the reaction around $111.7k–$112k this week.
Whether today’s flush proves to be prelude to capitulation or the trap before new highs, Ostium’s bottom line is clear: “we move much higher from early October” unless those weekly thresholds are accepted lower.
At press time, BTC traded at $113,002.
Why this matters
This bitcoin story adds another data point to the current market tape and is useful when read alongside nearby source coverage.
Original source
Read on NewsBTCRelated market context

Kalshi and Polymarket hit record $2.7 billion in weekly crypto volume
The surge in crypto prediction market volume highlights a shift towards short-term speculative trading, impacting traditional trad...

Bitwise Dogecoin ETF Reaches Scheduled Liquidation As Holders Face Cash Redemption
TL;DR: Bitwise’s BWOW Dogecoin ETF reached its announced October 22 liquidation distribution date, with remaining shareholders due...
CoinShares BTF Liquidation Sets Cash Payout And Earlier Options Expiry
TL;DR: CoinShares’ Bitcoin and Ether ETF has reached cash settlement. An OCC notice confirms the payout and brings later-dated BTF...

Ethereum (ETH) Price Prediction: Whale Rotates $155M Into ETH as Longs Surge Near $2,500
Ethereum is trying to stabilize after another volatile stretch, with price returning toward the mid-$2,400 region while several po...

Bitcoin ETFs Lose Over $635M In One Day Following Oil Price Spike
Bitcoin Magazine Bitcoin ETFs Lose Over $635M In One Day Following Oil Price Spike U.S. investors quickly reversed course on Thurs...
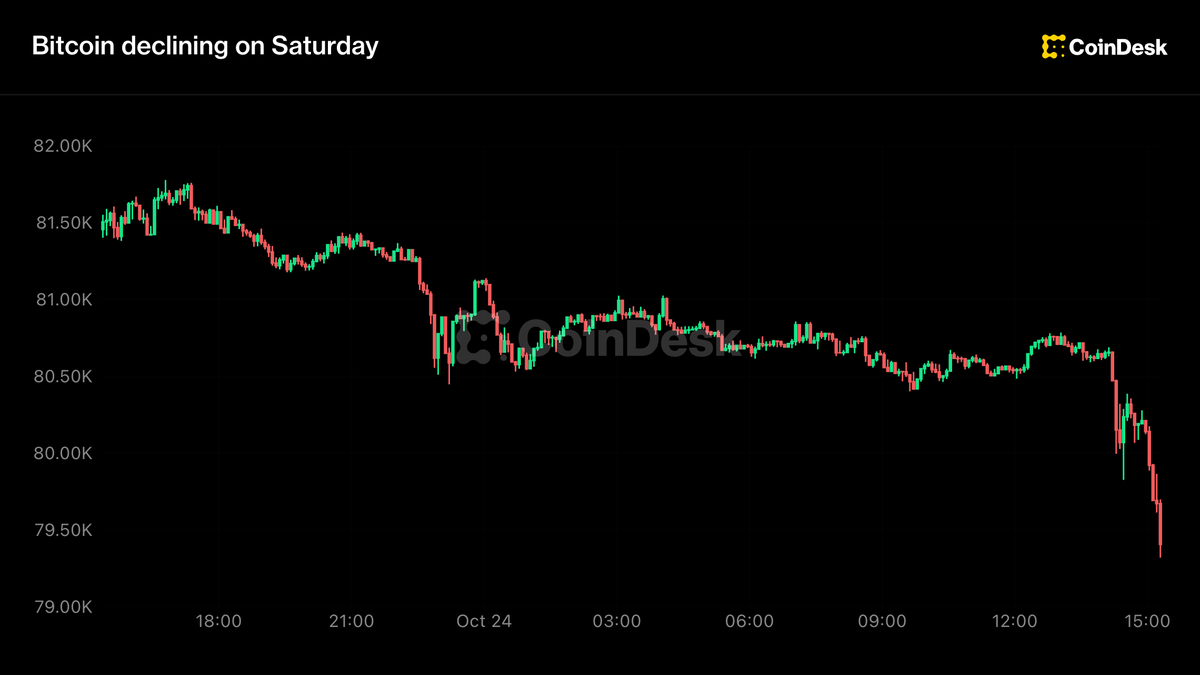
Crypto under weekend pressure, bitcoin slides below $80,000 on U.S. Middle East evacuations
Bitcoin has sunk to its weakest level in more than one month.