Bitcoin Price Crashes Amidst Wider Selloff – This Could Be The Next Stop
Bitcoin price plunged close to 8% over the past day owing to the high Consumer Price Index report. The prices of most altcoins fell on their respective charts after the CPI showed a 0.1% increase in August, which has now...
Archive context
Older archive item. Useful for background and entity history, but not a fresh market-moving signal.

Bitcoin price plunged close to 8% over the past day owing to the high Consumer Price Index report.
The prices of most altcoins fell on their respective charts after the CPI showed a 0.1% increase in August, which has now taken the unadjusted value to 8.3%.
The annual increase was expected to be 8.1%. Over the last 24 hours, Bitcoin registered a 4% loss.
Given that the market is undergoing an extended sell-off, a further fall in BTC’s value could be expected. The technical outlook for the coin was bearish as buyers left the market at the time of writing.
Bitcoin price has been struggling at $18,900 for the past month, but it has managed to break through this price level in the last week.
Bitcoin has soared past the $22,000 level. The recent blow from the CPI report has pushed the coin downwards.
Indicators have chosen to side with the bears given how sellers are dominating the market at press time. The global cryptocurrency market cap today is at $1.04 trillion, with a 2.5% negative change in the last 24 hours.
Bitcoin Price Analysis: One Day Chart Bitcoin was priced at $20,200 on the one-day chart | Source: BTCUSD on TradingViewBTC was trading at $20,200 at the time of writing. The plunge from the $22,000 mark was sudden due to the unanticipated number from the CPI report.
Immediate resistance for Bitcoin price was at the $21,000 mark. If BTC manages to topple this level, it can get back to trading above the $22,000 price mark.
Local support for BTC was at $19,200. However, with the intense sell-off, the coin could fall to trade near the $18,900 support line.
The amount of Bitcoin traded in the past session grew slightly, indicating that there was an influx of buying strength.
Technical Analysis Bitcoin displayed a small uptick in the number of buyers on the one-day chart | Source: BTCUSD on TradingViewBTC has registered a sharp fall in buying strength over the last 24 hours. This fall in buyers has further pushed the price near the nearest support line.
The Relative Strength Index was seen below the half-line, indicating strong selling strength and, therefore, bearishness.
Over the past few trading sessions, RSI noted a small uptick, indicating that the buying strength increased slightly.
Bitcoin price just fell through the 20-SMA line, which was also a sign that sellers were driving the price momentum in the market.
Bitcoin registered buy signal on the one-day chart | Source: BTCUSD on TradingViewBTC displayed buy signal despite the market registering a tiny buy signal after buying strength displayed an appreciation.
The Awesome Oscillator depicts the overall market strength and the direction of the price. AO climbed above the half-line, indicating that buyers could act on this price action.
Even if buyers act on the buy signal, the price of the asset would hardly notice an upward movement. The Directional Movement Index signals the price direction and momentum.
DMI was negative as the -DI (orange) line was above the +DI (blue) line. The Average Directional Index (red) was above the 20 mark, which means that the present price direction has gathered strength.
Featured image from Pixabay, Charts from TradingView.comWhy this matters
This bitcoin story adds another data point to the current market tape and is useful when read alongside nearby source coverage.
Original source
Read on NewsBTCRelated market context
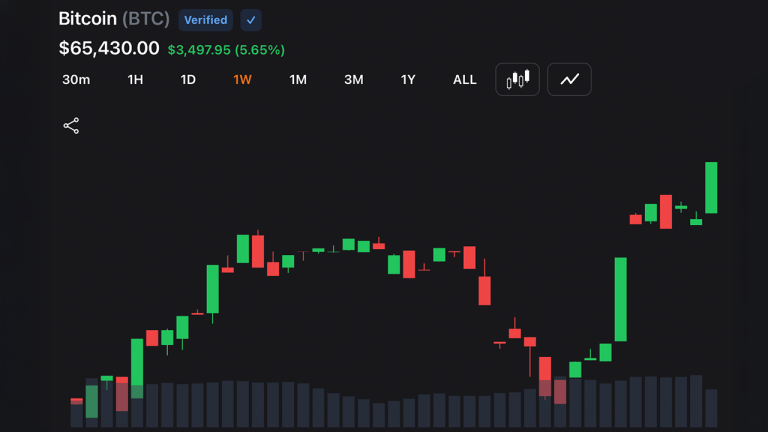
Bitcoin Blasts Past $65K as Soft Inflation Ignites Stocks, Gold and Crypto
Bitcoin broke above $65,000 on Wednesday morning at 8:30 a.m. EDT, after a softer-than-expected U.S. producer price report lifted...

Near $65K, Bitcoin’s 2 year social media drop off is hiding a $4.3 billion whale exit and a new class of buyers
Crypto discussion across X, Reddit, Telegram, and other major social channels has fallen to its second-lowest daily level since Oc...
Bitcoin Rises Above $65,000 as Inflation Posts Its Largest Monthly Drop Since 2020
Bitcoin rose above $65,000 on Tuesday after US inflation data showed consumer prices cooling far more than expected in June, easin...

Bitcoin Price Prediction: ETF Bouncing, Bitwise Sees Bottom and Huge Adoption
Bitcoin is trading near $64,700, up about 4% over the past day after rebounding from an ETF-driven selloff. The latest Bitcoin pri...

Ripple Joins x402 Foundation to Advance RLUSD AI Payments: Will XRP Price Benefit?
XRP price prediction is back in focus as it trades around $1.11, up about 3.6% over the past 24 hours. It remains pinned beneath a...

FOMC meets July 28–29 as stablecoin rulemaking deadline lands
TL;DR The GENIUS Act’s stablecoin rulemaking deadline lands July 18, when six federal agencies must finalize capital, reserve, and...