Bitcoin Price Dips Toward Decisive Support As Bears Regain Control
Bitcoin price corrected gains and tested the $66,500 support. BTC is now struggling and might decline further below the $65,000 zone. Bitcoin is struggling to recover losses and moving lower below $67,500. The price is t...
Archive context
Older archive item. Useful for background and entity history, but not a fresh market-moving signal.

Bitcoin price corrected gains and tested the $66,500 support. BTC is now struggling and might decline further below the $65,000 zone.
- Bitcoin is struggling to recover losses and moving lower below $67,500.
- The price is trading below $67,500 and the 100 hourly simple moving average.
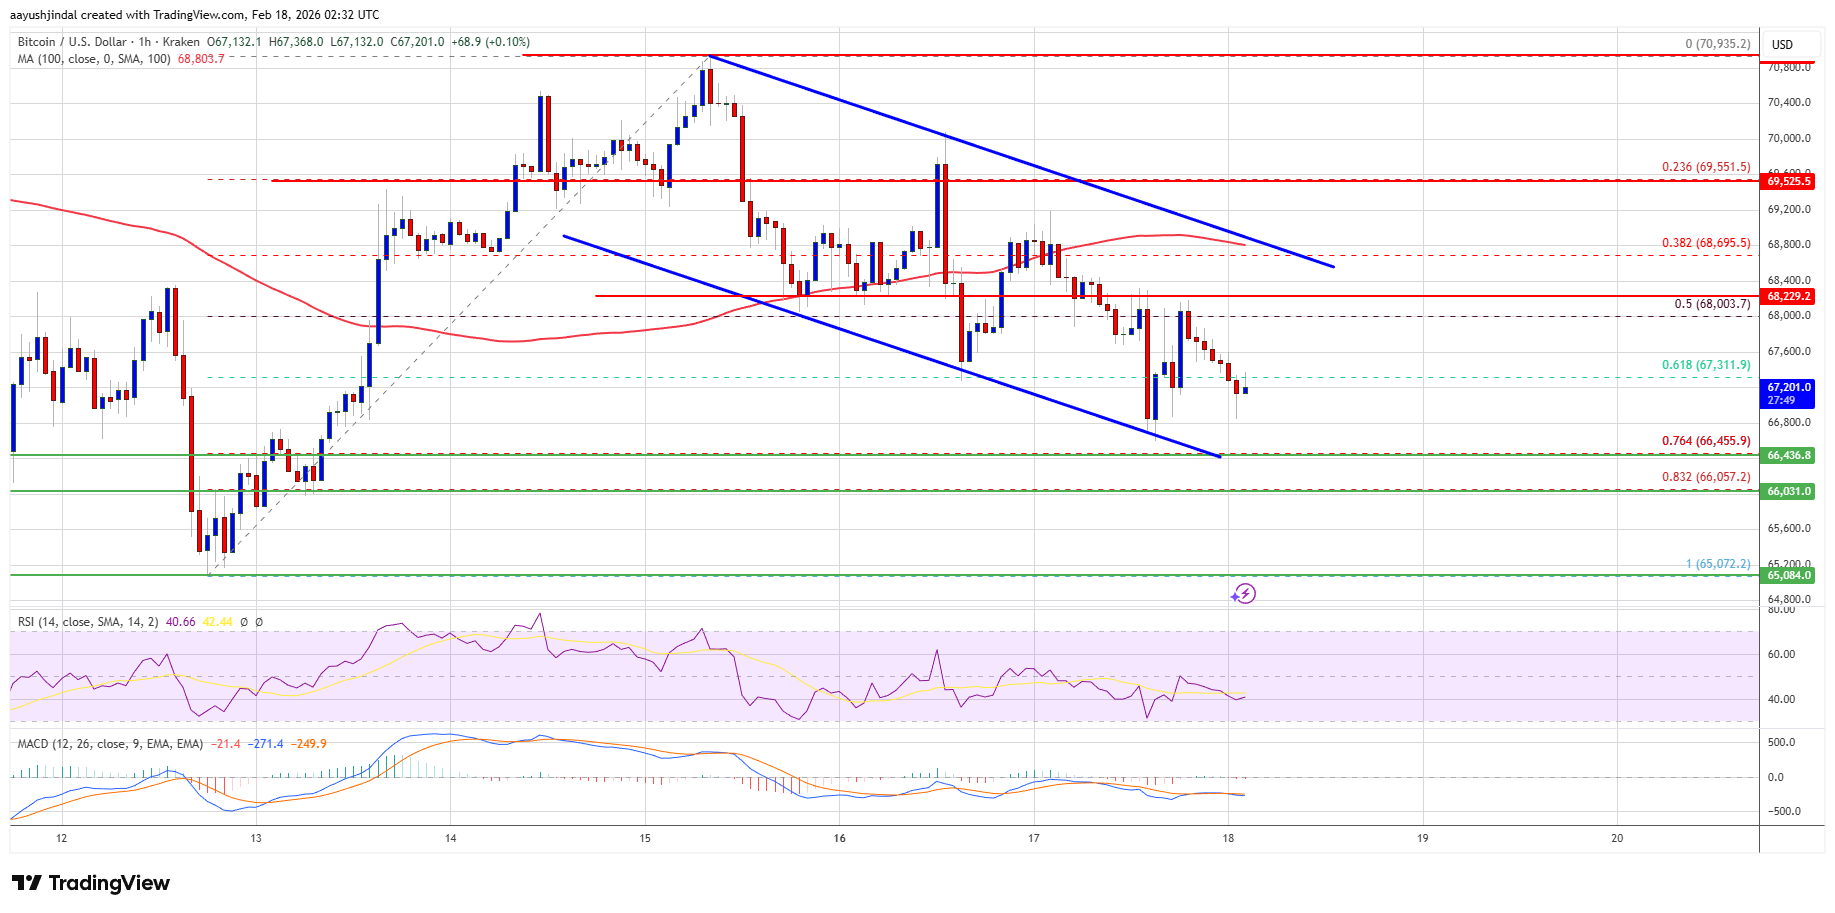
- There is a declining channel forming with resistance at $68,850 on the hourly chart of the BTC/USD pair (data feed from Kraken).
- The pair might dip again if it trades below the $66,500 and $66,000 levels.
Bitcoin price failed to remain stable above the $68,500 zone. BTC started a fresh decline and traded below the $67,800 support zone. There was a push below $67,200.
The price dipped below the 61.8% Fib retracement level of the upward move from the $65,072 swing low to the $70,935 high. However, the bulls remained active near the $66,500 zone. Besides, there is a declining channel forming with resistance at $68,850 on the hourly chart of the BTC/USD pair.
Bitcoin is now trading below $67,500 and the 100 hourly simple moving average. If the price remains stable above $66,500, it could attempt a fresh increase. Immediate resistance is near the $68,000 level.
The first key resistance is near the $68,850 level. A close above the $68,850 resistance might send the price further higher. In the stated case, the price could rise and test the $69,200 resistance. Any more gains might send the price toward the $70,000 level. The next barrier for the bulls could be $7`,200 and $72,000.
Another Decline In BTC?If Bitcoin fails to rise above the $68,850 resistance zone, it could start another decline. Immediate support is near the $66,500 level or the 76.4% Fib retracement level of the upward move from the $65,072 swing low to the $70,935 high. The first major support is near the $66,000 level.
The next support is now near the $65,000 zone. Any more losses might send the price toward the $64,200 support in the near term. The main support now sits at $63,500, below which BTC might struggle to recover in the near term.
Technical indicators:
Hourly MACD – The MACD is now gaining pace in the bullish zone.
Hourly RSI (Relative Strength Index) – The RSI for BTC/USD is now below the 50 level.
Major Support Levels – $66,500, followed by $66,000.
Major Resistance Levels – $68,000 and $68,850.
Why this matters
Bitcoin is a tracked market entity in the DigitalMoneyBox archive, making this useful context for readers monitoring repeated mentions and follow-up coverage.
Original source
Read on NewsBTCRelated market context

XRP Price Prediction: 1 Billion Unlock Fails to Suppress Rally as Ripple Pushes Above Key Resistance
Ripple’s latest 1 billion XRP escrow release arrived this week, yet the coin price barely blinked. XRP trades around $1.06, up abo...

BTC USD Recovering: Why is The Crypto Market Going Up Today, July 2nd?
After a rough June, the crypto market finally found its footing today. BTC USD climbed back above $60,000, while the total crypto...

XRP Ledger Lending Amendments Face 80% Validator Hurdle as Institutional Credit Layer Takes Shape
Ripple has formally proposed two XRPL amendments, XLS-65 and XLS-66, that would embed fixed-term institutional credit infrastructu...

Wall Street is selling Bitcoin but the old holders are now buying it back
Glassnode's latest Week Onchain report shows that roughly 10.83 million BTC are now in the red, against 9.22 million still in prof...

Introducing the Kraken API Partner Program: turn your platform into a global crypto and capital markets venue
TL;DR The Kraken API Partner Program connects trading platforms directly to Kraken’s infrastructure for spot, futures, and xStocks...

Ethereum Price Prediction: Lubin, Bitmine, and Sharplink Launch Independent Non-Profit Institution to Bring Institutional Wealth Onchain
Ethereum price is trading near $1,650, remaining below its major moving averages and preserving a bearish prediction. However, the...