Bitcoin Price Downtrend Continues: Brace for More Losses
Bitcoin price failed to start a recovery wave above the $58,500 resistance zone. BTC started another decline and might extend losses below $54,000. Bitcoin started a fresh decline and traded below the $56,500 zone. The p...
Archive context
Older archive item. Useful for background and entity history, but not a fresh market-moving signal.

Bitcoin price failed to start a recovery wave above the $58,500 resistance zone. BTC started another decline and might extend losses below $54,000.
- Bitcoin started a fresh decline and traded below the $56,500 zone.
- The price is trading below $56,500 and the 100 hourly Simple moving average.
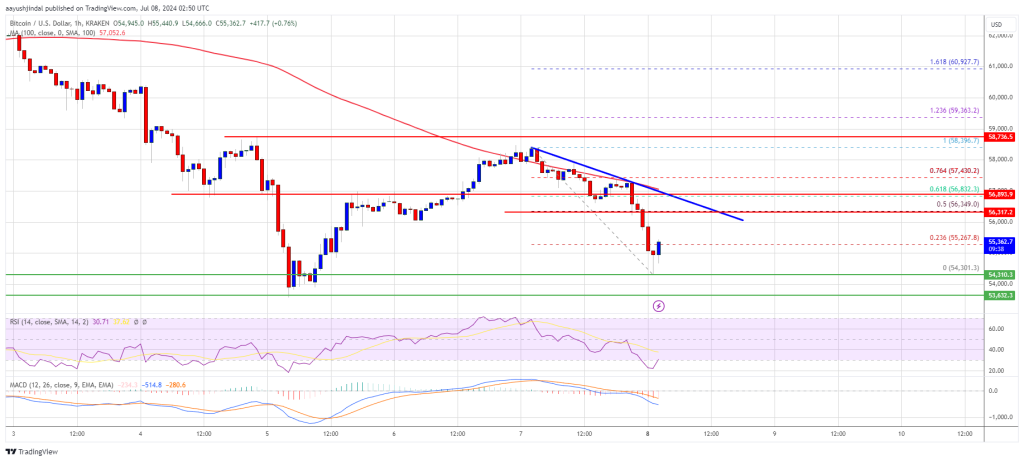
- There is a connecting bearish trend line forming with resistance at $56,350 on the hourly chart of the BTC/USD pair (data feed from Kraken).
- The pair might struggle to start a fresh increase above the $58,000 resistance zone.
Bitcoin price started a recovery wave above the $57,000 level. BTC even climbed above the $58,000 level. However, the bears were active near the $58,500 resistance zone.
A high was formed at $58,396 and the price started a fresh decline. There was a drop below the $57,000 and $56,500 level. A low has formed near $54,301 and the price is now consolidating losses. There was a minor increase toward the 23.6% Fib retracement level of the downward move from the $58,396 swing high to the $54,301 low.
Bitcoin price is still trading below $56,500 and the 100 hourly Simple moving average. Immediate resistance on the upside is near the $56,000 level. The first key resistance is near the $56,400 level.
There is also a connecting bearish trend line forming with resistance at $56,350 on the hourly chart of the BTC/USD pair. The trend line is near the 50% Fib retracement level of the downward move from the $58,396 swing high to the $54,301 low. A clear move above the trend line might send the price toward the $57,400 level. The next key resistance could be $58,400.
A close above the $58,40 resistance might start a steady increase and send the price higher. In the stated case, the price could rise and test the $60,000 resistance in the coming sessions.
More Losses In BTC?If Bitcoin fails to climb above the $56,400 resistance zone, it could continue to move down. Immediate support on the downside is near the $54,400 level.
The first major support is $53,650. The next support is now forming near $53,200. Any more losses might send the price toward the $52,000 support zone in the near term.
Technical indicators:
Hourly MACD – The MACD is now gaining pace in the bearish zone.
Hourly RSI (Relative Strength Index) – The RSI for BTC/USD is now below the 50 level.
Major Support Levels – $54,400, followed by $53,500.
Major Resistance Levels – $56,400, and $58,400.
Why this matters
This bitcoin story adds another data point to the current market tape and is useful when read alongside nearby source coverage.
Original source
Read on NewsBTCRelated market context

Bitcoin (BTC) Price Prediction: BTC Holds $63K Support—Can Rising Active Addresses Offset Bearish Technical Signals?
Although the BTC price has remained near a key support zone, recent chart signals and Strategy’s sale of a portion of its Bitcoin...

XRP Price Prediction: Volume and ETF Inflow Send Ripple Token Higher
XRP price pushed above the $1.14 resistance area after buyers stepped in with heavy volume and bullish prediction. The token climb...

Ethereum Price Prediction: Vitalik Hints at 3-4 Years Long ETH Rebuild
Ethereum price is trading at $1,780 as Vitalik Buterin revealed the network’s biggest roadmap since the Merge, which somehow sends...

Bitcoin Price Prediction: Peter Brandt Might Dump BTC for Gold
Bitcoin is facing a test, and its price prediction is not helping. So far in 2026, BTC has fallen about 28%, while gold is down ju...

Ethereum’s EIP-8222 wants to make staking anonymous, and it might actually work
EIP-8222 could enhance Ethereum's privacy, potentially boosting user confidence but also attracting regulatory scrutiny over anony...

Bitmine’s Tom Lee ties ether strength to Clarity Act odds as treasury nears 5% of Ethereum’s total supply
Bitmine acquired 42,197 ether worth an estimated $74 million last week, lifting its treasury to over 5.7 million ETH.