Bitcoin Price Drops Under $60K Again: Can It Stage a Recovery?
Bitcoin price started a fresh decline and traded below $60,000. BTC is struggling and might continue to move down toward the $56,500 support. Bitcoin gained bearish momentum below the $62,000 support level. The price is...
Archive context
Older archive item. Useful for background and entity history, but not a fresh market-moving signal.

Bitcoin price started a fresh decline and traded below $60,000. BTC is struggling and might continue to move down toward the $56,500 support.
- Bitcoin gained bearish momentum below the $62,000 support level.
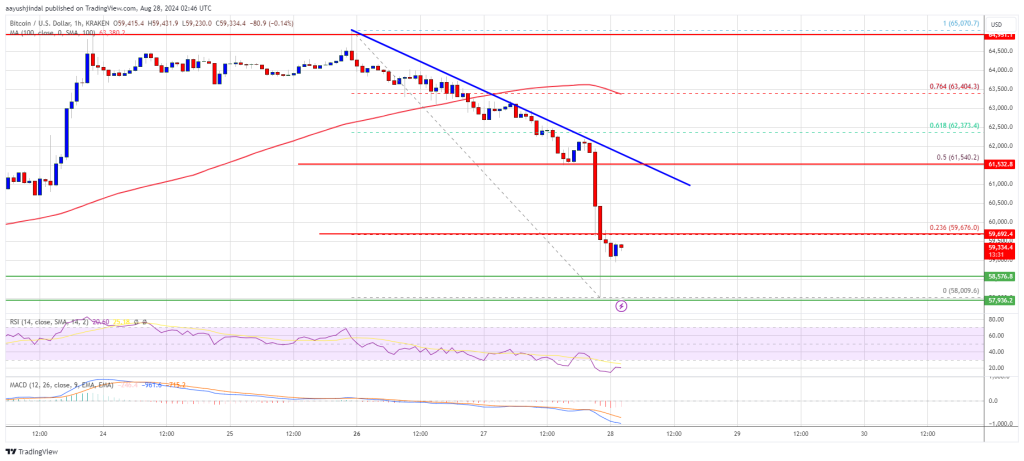
- The price is trading below $62,000 and the 100 hourly Simple moving average.
- There is a key bearish trend line forming with resistance at $61,500 on the hourly chart of the BTC/USD pair (data feed from Kraken).
- The pair might slip further toward the $56,500 level before the bulls appear.
Bitcoin price failed to recover and extended losses below the $62,500 level. The bears took over and pushed the price below the $61,200 level. The price even dived below the $60,000 level.
A low was formed at $58,009 and the price is now consolidating losses. There was a minor recovery wave above the $58,500 and $59,000 levels. The price traded close to the 23.6% Fib retracement level of the downward move from the $65,070 swing high to the $58,009 low.
Bitcoin is now trading below $61,500 and the 100 hourly Simple moving average. On the upside, the price could face resistance near the $59,800 level. The first key resistance is near the $60,000 level. A clear move above the $60,000 resistance might send the price further higher in the coming sessions.
The next key resistance could be $61,500. There is also a key bearish trend line forming with resistance at $61,500 on the hourly chart of the BTC/USD pair. It is close to the 50% Fib retracement level of the downward move from the $65,070 swing high to the $58,009 low. A close above the $61,500 resistance might spark more upsides. In the stated case, the price could rise and test the $62,500 resistance.
More Downsides In BTC?If Bitcoin fails to rise above the $60,000 resistance zone, it could continue to move down. Immediate support on the downside is near the $58,500 level.
The first major support is $58,000. The next support is now near the $57,650 zone. Any more losses might send the price toward the $56,500 support in the near term.
Technical indicators:
Hourly MACD – The MACD is now gaining pace in the bearish zone.
Hourly RSI (Relative Strength Index) – The RSI for BTC/USD is now below the 50 level.
Major Support Levels – $58,500, followed by $58,000.
Major Resistance Levels – $60,000, and $61,500.
Why this matters
This bitcoin story adds another data point to the current market tape and is useful when read alongside nearby source coverage.
Original source
Read on NewsBTCRelated market context

Ethereum (ETH) Price Prediction: ETH Holds Near $1,780 as Bulls Eye $1,860–$1,950, but $1,609 Remains Key Invalidation
Ethereum price is trading near $1,779 after a mixed 24-hour session, according to Brave New Coin data. ETH is down around 0.76% on...

Solana Price Prediction: SOL Holds Near $81 as Breakout Setup Points to $87, but Whale Flows Keep Risk Active
Solana price is back in focus after a sharp recovery pushed SOL towards the $81 area. The move has improved short-term momentum, e...

Bitcoin Price Prediction: Peter Brandt Might Dump BTC for Gold
Bitcoin is facing a test, and its price prediction is not helping. So far in 2026, BTC has fallen about 28%, while gold is down ju...

Ethereum Price Prediction: Vitalik Hints at 3-4 Years Long ETH Rebuild
Ethereum price is trading at $1,780 as Vitalik Buterin revealed the network’s biggest roadmap since the Merge, which somehow sends...

Hyperliquid (HYPE) Price Prediction: Symmetrical Triangle Breakout Puts $77 Target Back in Focus
The breakout comes after several sessions of price compression, with HYPE continuing to trade within a broader technical structure...

Bitcoin Rebounds Toward $63,000, But ETF Flows Still Hold The Key
Bitcoin has started the new week with a little more colour on the screen. After sliding through the kind of levels that usually tr...