Bitcoin Price Extends Rally Above $42K But Signs of Trend Exhaustion Appear
Bitcoin price extended its rally above the $42,000 resistance. BTC is now correcting gains and might test the $40,800 support zone. Bitcoin surged further above the $41,200 and $42,000 levels. The price is trading above...
Archive context
Older archive item. Useful for background and entity history, but not a fresh market-moving signal.

Bitcoin price extended its rally above the $42,000 resistance. BTC is now correcting gains and might test the $40,800 support zone.
- Bitcoin surged further above the $41,200 and $42,000 levels.
- The price is trading above $41,200 and the 100 hourly Simple moving average.
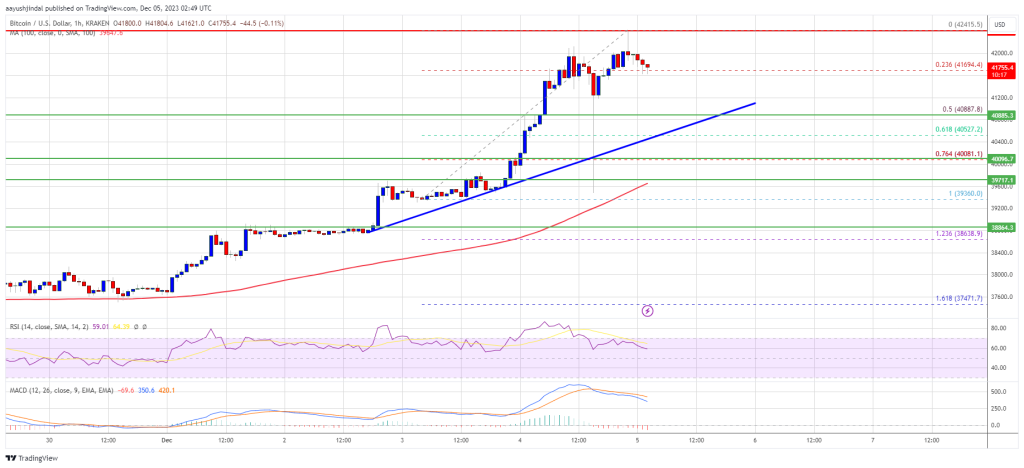
- There is a major bullish trend line forming with support near $40,880 on the hourly chart of the BTC/USD pair (data feed from Kraken).
- The pair could correct lower toward $40,800 before it starts a fresh increase.
Bitcoin price started a strong increase above the $38,500 resistance zone. BTC gained over 10% in the past few sessions and broke many hurdles near $40,000.
It even cleared the $41,200 resistance and spiked above the $42,000 zone. A new multi-month high is formed near $42,415 and the price is now correcting gains. There was a move below the $42,000 level. The price is now testing the 23.6% Fib retracement level of the upward move from the $39,360 swing low to the $42,415 high.
Bitcoin also trades above $41,200 and the 100 hourly Simple moving average. Besides, there is a major bullish trend line forming with support near $40,880 on the hourly chart of the BTC/USD pair. The trend line is close to the 50% Fib retracement level of the upward move from the $39,360 swing low to the $42,415 high.
On the upside, immediate resistance is near the $42,200 level. The first major resistance is forming near $42,500, above which the price might rise toward the $43,200 level.
Source: BTCUSD on TradingView.com
A close above the $43,200 resistance might send the price further higher. The next key resistance could be near $44,000, above which BTC could rise toward the $45,000 level.
Are Dips Limited In BTC?If Bitcoin fails to rise above the $42,200 resistance zone, it could start a downside correction. Immediate support on the downside is near the $41,200 level.
The next major support is near $40,800 and the trend line. If there is a move below $40,800, there is a risk of more downsides. In the stated case, the price could drop toward the $40,000 support in the near term.
Technical indicators:
Hourly MACD – The MACD is now losing pace in the bullish zone.
Hourly RSI (Relative Strength Index) – The RSI for BTC/USD is now above the 50 level.
Major Support Levels – $41,200, followed by $40,800.
Major Resistance Levels – $42,200, $42,500, and $43,200.
Why this matters
This bitcoin story adds another data point to the current market tape and is useful when read alongside nearby source coverage.
Original source
Read on NewsBTCRelated market context

Bitcoin (BTC) Price Prediction: $65K Remains Key Resistance as 4-Year Cycle Model Signals Make-or-Break Moment
The Bitcoin price today remains around $62,600-$62,900, according to TradingView data, reflecting a market that has stabilized fol...

Litecoin (LTC) Price Prediction: Mixed Technical Signals and Growing Hashrate Keep Traders Focused on $39 Support and $46 Breakout
Analysts are closely watching whether the Litecoin price can maintain support around $39 and break above the key $46 resistance le...

Ethereum Price Prediction: Hoskinson Accuses ETH of Taking Cardano Ideas Without Credit
Ethereum price has slipped as fresh ecosystem drama landed, which may bring its prediction down. All the while, buyers tried to de...

Why Bitcoin ATMs are becoming the last stop in America’s $11B crypto scam pipeline
Crypto scams start online with a fake bank alert, a cloned voice, a romance message, or a tech-support pop-up. Then, the last inst...

Cardano’s wallet hack exposed the user layer holding its on-chain government together
EMURGO said it is stepping down from its role in Pentad, the five-member group coordinating Cardano's infrastructure funding, to f...

Micron stock surges nearly 200% in 2026 as AI memory demand meets tokenized trading on Ethereum and Solana
Micron's stock surge highlights the transformative impact of AI and blockchain on traditional finance, with potential risks from m...