Bitcoin Price Faces Potential Dive: Key Support Levels to Monitor
Bitcoin price failed to recover above the $62,500 resistance zone. BTC is showing bearish signs and might decline again below the $60,000 support. Bitcoin struggled to recover above the $62,200 and $62,500 levels. The pr...
Archive context
Older archive item. Useful for background and entity history, but not a fresh market-moving signal.

Bitcoin price failed to recover above the $62,500 resistance zone. BTC is showing bearish signs and might decline again below the $60,000 support.
- Bitcoin struggled to recover above the $62,200 and $62,500 levels.
- The price is trading below $62,000 and the 100 hourly Simple moving average.
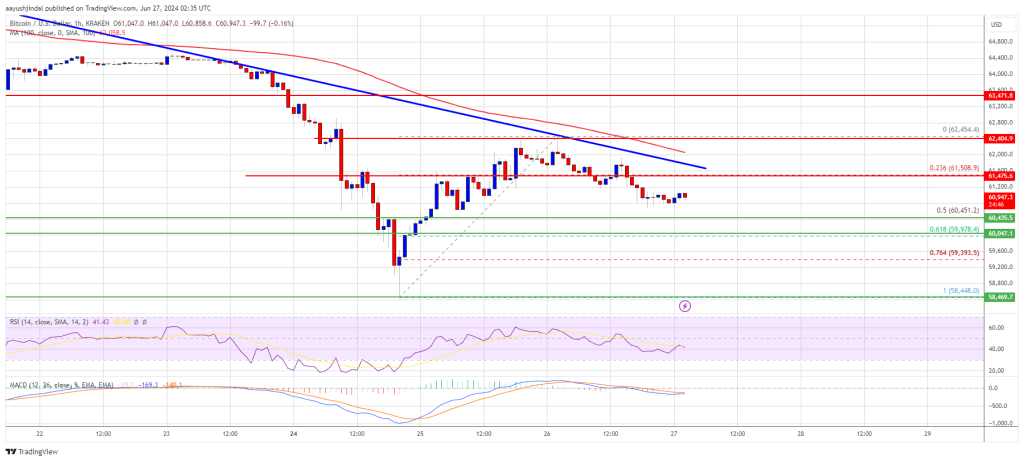
- There is a major bearish trend line forming with resistance at $61,850 on the hourly chart of the BTC/USD pair (data feed from Kraken).
- The pair might start another decline unless there is a close above the $62,000 resistance zone.
Bitcoin price started a recovery wave above the $61,200 zone. BTC even attempted a move above the $62,000 resistance zone. However, the bears were active near the $62,500 zone.
A high was formed at $62,454 and the price is now moving lower. There was a move below the $61,500 level. The price declined below the 23.6% Fib retracement level of the upward move from the $58,448 swing low to the $62,454 high.
Bitcoin price is trading below $62,000 and the 100 hourly Simple moving average. There is also a major bearish trend line forming with resistance at $61,850 on the hourly chart of the BTC/USD pair.
The price is now stable above the 50% Fib retracement level of the upward move from the $58,448 swing low to the $62,454 high. If there is another increase, the price could face resistance near the $61,500 level. The first key resistance is near the $61,850 level and the trend line.
The next key resistance could be $62,000. A clear move above the $62,000 resistance might start a steady increase and send the price higher. In the stated case, the price could rise and test the $62,500 resistance. Any more gains might send BTC toward the $63,500 resistance in the near term.
More Losses In BTC?If Bitcoin fails to climb above the $62,000 resistance zone, it could start another decline. Immediate support on the downside is near the $60,450 level.
The first major support is $60,000. The next support is now forming near $59,500. Any more losses might send the price toward the $58,500 support zone in the near term.
Technical indicators:
Hourly MACD – The MACD is now gaining pace in the bearish zone.
Hourly RSI (Relative Strength Index) – The RSI for BTC/USD is now below the 50 level.
Major Support Levels – $60,500, followed by $60,000.
Major Resistance Levels – $62,000, and $62,500.
Why this matters
This bitcoin story adds another data point to the current market tape and is useful when read alongside nearby source coverage.
Original source
Read on NewsBTCRelated market context

Bitcoin (BTC) Price Prediction: BTC Holds $63K Support—Can Rising Active Addresses Offset Bearish Technical Signals?
Although the BTC price has remained near a key support zone, recent chart signals and Strategy’s sale of a portion of its Bitcoin...

Bitcoin price rebounds to $63K as leverage returns creating short term volatility risk
Bitcoin's rebound has cleared the first test: price recovered. The harder one starts now: proving buyers remain after the squeeze....

Sui DeFi TVL Breaks $1 Billion As Move-Based Chains Fight For Liquidity
Sui has crossed the $1 billion total value locked mark on DeFiLlama, giving the Move-based network a clearer claim to serious DeFi...

SEC Closes Consensys Ethereum 2.0 Probe, Removing A Major Staking Overhang
Ethereum has one less regulatory cloud hanging over it after Consensys said the U.S. Securities and Exchange Commission has closed...

Bitcoin miner bottom signal now depends on who survives weak mining profits
A Bitcoin miner-stress signal circulating on X has fallen into a zone analysts associate with severe miner pressure, putting a fam...

New SummerFi DeFi exploit shows AI automation now sits above smart contract risk
Summer.fi's automated vault incident has put delegated DeFi yield back under pressure after Blockaid said on July 6 that its explo...