Bitcoin Price Faces Pressure: Technicals Signal Another Decline Ahead
Bitcoin price is showing bearish signs below $113,000. BTC is struggling to recover and might start another decline below the $111,000 zone. Bitcoin started a recovery wave above the $109,550 zone. The price is trading b...
Archive context
Older archive item. Useful for background and entity history, but not a fresh market-moving signal.

Bitcoin price is showing bearish signs below $113,000. BTC is struggling to recover and might start another decline below the $111,000 zone.
- Bitcoin started a recovery wave above the $109,550 zone.
- The price is trading below $112,000 and the 100 hourly Simple moving average.
- There was a break below a key bullish trend line with support at $112,000 on the hourly chart of the BTC/USD pair (data feed from Kraken).
- The pair might start another decline if it breaks the $110,750 support zone.
Bitcoin price attempted a fresh recovery wave from the $108,734 low. BTC was able to climb above the $109,500 and $110,000 resistance levels.
The price surpassed the 23.6% Fib retracement level of the key drop from the $117,355 swing high to the $110,734 low. The bulls even pushed the price above the $112,500 resistance zone. However, the price struggled to stay above the $113,000 resistance.
It retreated from the 50% Fib level of the key drop from the $117,355 swing high to the $110,734 low. Besides, there was a break below a key bullish trend line with support at $112,000 on the hourly chart of the BTC/USD pair.
Bitcoin is now trading below $112,000 and the 100 hourly Simple moving average. Immediate resistance on the upside is near the $112,400 level. The first key resistance is near the $113,000 level. The next resistance could be $113,500.

A close above the $113,500 resistance might send the price further higher. In the stated case, the price could rise and test the $114,000 resistance level. Any more gains might send the price toward the $115,500 level. The main target could be $116,500.
More Losses In BTC?If Bitcoin fails to rise above the $113,000 resistance zone, it could start a fresh decline. Immediate support is near the $110,750 level. The first major support is near the $110,000 level.
The next support is now near the $109,500 zone. Any more losses might send the price toward the $108,500 support in the near term. The main support sits at $106,500, below which BTC might decline sharply.
Technical indicators:
Hourly MACD – The MACD is now gaining pace in the bearish zone.
Hourly RSI (Relative Strength Index) – The RSI for BTC/USD is now below the 50 level.
Major Support Levels – $110,750, followed by $109,500.
Major Resistance Levels – $112,500 and $113,000.
Why this matters
This bitcoin story adds another data point to the current market tape and is useful when read alongside nearby source coverage.
Original source
Read on NewsBTCRelated market context
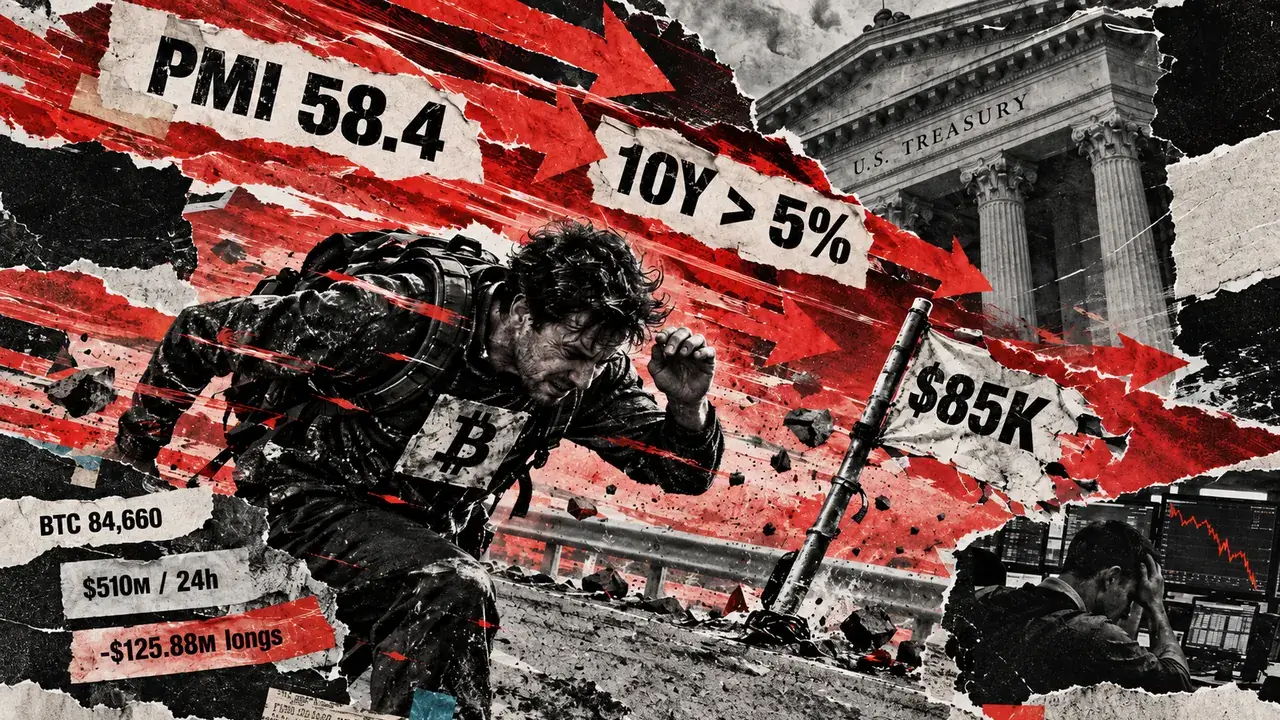
Bitcoin slips below $85,000 as 5% Treasury yield returns to haunt risk assets
Bitcoin fell below $85,000 on Sept. 23 after stronger-than-expected US business activity sent Treasury yields higher and flushed l...

Hyperliquid (HYPE) Price Prediction: Can Whale Buying and Binance Listing Drive HYPE to $210?
The technical setup for Hyperliquid price currently places $110, $130, $160, and $180 among the key levels to watch, while some tr...

Why surging US real yields are quietly forcing Bitcoin under $84,000
Bitcoin registered an intraday low at $83,500 on Sept. 23, the same day the US 10-year Treasury yield closed at 5.11%, up 15 basis...

Mid-Sized Bitcoin Wallets Add 113,950 Bitcoin as Price Rally Nears Test
Wallets holding between 100 and 1,000 BTC have added 113,950 Bitcoin since July 15, lifting their combined holdings 2.22% to 5.24...

Crypto’s bear market wiped out over $2 trillion, yet on-chain activity held above $9 trillion
The crypto industry lost $2.1 trillion in market value during the past year, yet measured on-chain economic activity declined just...

Crypto News Today: XRP, Dogecoin Signal Long-Term MVRV Discounts as Bitcoin Holds $82.5K Neckline
On-chain analytics firm Santiment reported that XRP’s 365-day Market Value to Realized Value (MVRV) stood at approximately -11.75%...