Bitcoin Price Falls Again: Is Bearish Momentum Returning?
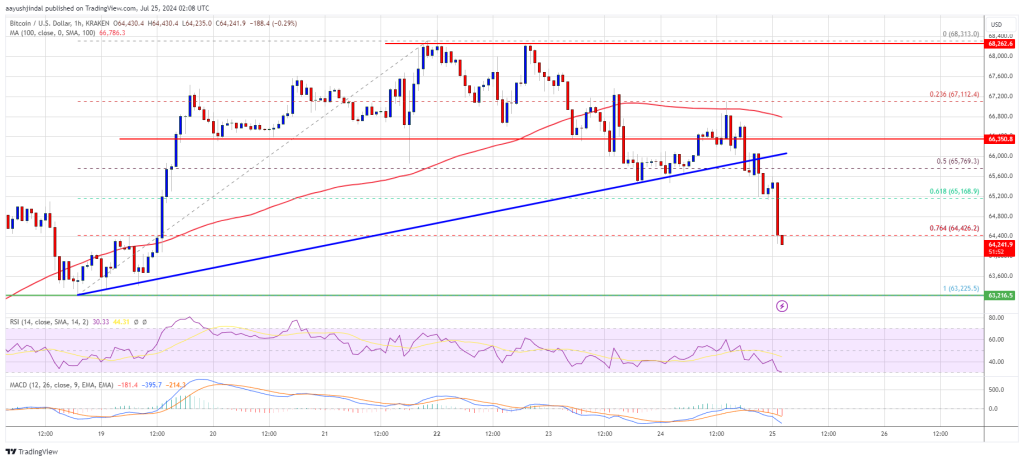
Bitcoin price started another decline below the $66,500 level. BTC is gaining bearish momentum and might revisit the $63,200 support. Bitcoin started a fresh decline from the $68,500 resistance zone. The price is trading...
Archive context
Older archive item. Useful for background and entity history, but not a fresh market-moving signal.

Bitcoin price started another decline below the $66,500 level. BTC is gaining bearish momentum and might revisit the $63,200 support.
- Bitcoin started a fresh decline from the $68,500 resistance zone.
- The price is trading below $65,500 and the 100 hourly Simple moving average.
- There was a break below a key bullish trend line with support at $66,000 on the hourly chart of the BTC/USD pair (data feed from Kraken).
- The pair might extend losses and trade toward the $63,200 support zone.
Bitcoin price failed to hold gains above the $66,500 support level. BTC started another decline and traded below the $66,000 support zone. There was a move below the 50% Fib retracement level of the upward move from the $63,225 swing low to the $68,313 high.
Besides, there was a break below a key bullish trend line with support at $66,000 on the hourly chart of the BTC/USD pair. The pair is now accelerating lower below the $65,000 level.
Bitcoin price is now trading below $66,000 and the 100 hourly Simple moving average. It is also below the 76.4% Fib retracement level of the upward move from the $63,225 swing low to the $68,313 high. If there is a recovery wave, the price could face resistance near the $65,200 level.
The first key resistance is near the $65,500 level. A clear move above the $65,500 resistance might spark another increase in the coming sessions. The next key resistance could be $66,200. The next major hurdle sits at $66,800 and the 100 hourly Simple moving average. A close above the $66,800 resistance might push the price further higher. In the stated case, the price could rise and test the $68,000 resistance.
More Losses In BTC?If Bitcoin fails to recover above the $65,500 resistance zone, it could continue to move down. Immediate support on the downside is near the $64,000 level.
The first major support is $63,200. The next support is now near $62,500. Any more losses might send the price toward the $61,500 support zone in the near term.
Technical indicators:
Hourly MACD – The MACD is now gaining pace in the bearish zone.
Hourly RSI (Relative Strength Index) – The RSI for BTC/USD is now below the 50 level.
Major Support Levels – $64,000, followed by $63,200.
Major Resistance Levels – $65,500, and $66,800.
Why this matters
This bitcoin story adds another data point to the current market tape and is useful when read alongside nearby source coverage.
Original source
Read on NewsBTCRelated market context

Ethereum (ETH) Price Prediction: ETH Holds Near $1,780 as Bulls Eye $1,860–$1,950, but $1,609 Remains Key Invalidation
Ethereum price is trading near $1,779 after a mixed 24-hour session, according to Brave New Coin data. ETH is down around 0.76% on...

Bitcoin (BTC) Price Prediction: BTC Holds $63K Support—Can Rising Active Addresses Offset Bearish Technical Signals?
Although the BTC price has remained near a key support zone, recent chart signals and Strategy’s sale of a portion of its Bitcoin...

Bitcoin Price Prediction: Peter Brandt Might Dump BTC for Gold
Bitcoin is facing a test, and its price prediction is not helping. So far in 2026, BTC has fallen about 28%, while gold is down ju...

Dormant $1.9M Bitcoin tied to New York lawsuit moves after nearly 15 years
A Bitcoin address dormant for nearly 15 years moved $1.9 million in BTC as a New York lawsuit seeks ownership of thousands of inac...

XRP Price Prediction: Volume and ETF Inflow Send Ripple Token Higher
XRP price pushed above the $1.14 resistance area after buyers stepped in with heavy volume and bullish prediction. The token climb...

Ethereum Price Prediction: Vitalik Hints at 3-4 Years Long ETH Rebuild
Ethereum price is trading at $1,780 as Vitalik Buterin revealed the network’s biggest roadmap since the Merge, which somehow sends...