Bitcoin Price Falls Once More: Are Bears Poised for Another Drop?
Bitcoin price started another decline from the $59,500 level. BTC is moving lower, and the bears could gain strength below the $56,000 support. Bitcoin started another decline from the $59,500 resistance zone. The price...
Archive context
Older archive item. Useful for background and entity history, but not a fresh market-moving signal.

Bitcoin price started another decline from the $59,500 level. BTC is moving lower, and the bears could gain strength below the $56,000 support.
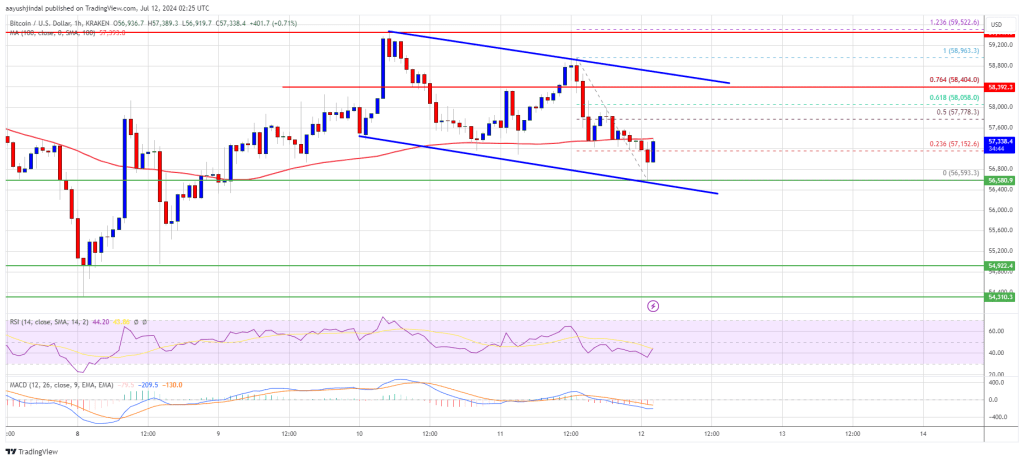
- Bitcoin started another decline from the $59,500 resistance zone.
- The price is trading below $57,500 and the 100 hourly Simple moving average.
- There is a key declining channel forming with resistance at $58,400 on the hourly chart of the BTC/USD pair (data feed from Kraken).
- The pair might continue to move down if it fails to stay above the $56,500 support.
Bitcoin price struggled to clear the $59,500 and $60,000 resistance levels. BTC peaked near the $59,500 resistance zone and recently started another decline. There was a move below the $58,500 level.
The price declined below the $57,800 and $57,500 support levels. It tested the $56,600 zone. A low was formed at $56,593 and the price is now consolidating losses. It is trading near the 23.6% Fib retracement level of the downward move from the $58,963 swing high to the $56,593 low.
Bitcoin price is now trading below $57,500 and the 100 hourly Simple moving average. Immediate resistance on the upside is near the $57,750 level. The first key resistance is near the $58,000 level or the 61.8% Fib retracement level of the downward move from the $58,963 swing high to the $56,593 low.
A clear move above the $58,000 resistance might start a decent increase in the coming sessions. The next key resistance could be $58,500. There is also a key declining channel forming with resistance at $58,400 on the hourly chart of the BTC/USD pair.
The next major hurdle sits at $59,500. A close above the $59,500 resistance might start a steady increase and send the price higher. In the stated case, the price could rise and test the $60,000 resistance.
More Downsides In BTC?If Bitcoin fails to climb above the $58,000 resistance zone, it could continue to move down. Immediate support on the downside is near the $56,600 level.
The first major support is $56,000. The next support is now near $55,000. Any more losses might send the price toward the $53,500 support zone in the near term.
Technical indicators:
Hourly MACD – The MACD is now gaining pace in the bearish zone.
Hourly RSI (Relative Strength Index) – The RSI for BTC/USD is now below the 50 level.
Major Support Levels – $56,500, followed by $55,000.
Major Resistance Levels – $58,000, and $58,500.
Why this matters
This bitcoin story adds another data point to the current market tape and is useful when read alongside nearby source coverage.
Original source
Read on NewsBTCRelated market context

Bitcoin (BTC) Price Prediction: BTC Holds $63K Support—Can Rising Active Addresses Offset Bearish Technical Signals?
Although the BTC price has remained near a key support zone, recent chart signals and Strategy’s sale of a portion of its Bitcoin...

Ethereum (ETH) Price Prediction: ETH Holds Near $1,780 as Bulls Eye $1,860–$1,950, but $1,609 Remains Key Invalidation
Ethereum price is trading near $1,779 after a mixed 24-hour session, according to Brave New Coin data. ETH is down around 0.76% on...

Bitcoin Price Prediction: Peter Brandt Might Dump BTC for Gold
Bitcoin is facing a test, and its price prediction is not helping. So far in 2026, BTC has fallen about 28%, while gold is down ju...

XRP Price Prediction: Volume and ETF Inflow Send Ripple Token Higher
XRP price pushed above the $1.14 resistance area after buyers stepped in with heavy volume and bullish prediction. The token climb...

Ether leads crypto's hold above key levels as bitcoin steadies over $63,000
A stalling rebound in AI and chip stocks and a stronger dollar kept the mood cautious as the second half gets underway.

IPO volume hits levels last seen in 1929 and 2000, and crypto markets are building the on-ramp
The surge in IPOs and crypto's role in facilitating access could signal heightened market volatility and regulatory challenges ahe...