Bitcoin Price Flashes Major Buy Signal On The 4-Hour TD Sequential Chart, Where To Enter?
A crypto analyst has shared a TD Sequential chart indicating that the Bitcoin price is flashing a major buy signal in the 4-hour time frame. This signal suggests that Bitcoin’s bearish momentum could be waning, making th...
Archive context
Older archive item. Useful for background and entity history, but not a fresh market-moving signal.
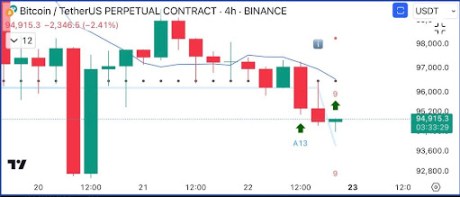
A crypto analyst has shared a TD Sequential chart indicating that the Bitcoin price is flashing a major buy signal in the 4-hour time frame. This signal suggests that Bitcoin’s bearish momentum could be waning, making this a potentially critical moment to consider entering the market.
Bitcoin Price TD Sequential Flashes Buy SignalA TD Sequential is a unique technical indicator that identifies trend exhaustion and price reversals and indicates buy or sell signals. According to an X (formerly Twitter) post by crypto analyst Ali Martinez, Bitcoin’s 4-hour chart showcases a green “9” candle, signaling a potential buying opportunity.
Typically, in a downtrend, the green 9 candle is interpreted as a buy signal, indicating that bearish momentum might be reaching exhaustion and prices could be getting ready for a rebound. Martinez also shows an ”A13” marker on the TD Sequential chart, which represents a countdown phase that tracks 13 additional candles and identifies a stronger trend exhaustion.
During a downtrend, the appearance of a TD Sequential A13 often signals a potential decline in a cryptocurrency’s sell-off phase, reinforcing the possibility of a price reversal. Bitcoin’s current buy signal emerged as its price exceeded $94,000. This buy signal suggests an optimal time to enter the market, with the $94,915 price point highlighted as a potential entry for traders aiming to capitalize on a possible Bitcoin price rebound.
Although the TD Sequential is an indicator used to identify buy and sell signals, market participants can exercise caution by considering additional factors like volatility, broader market sentiment, and more. If the current buy signal holds, Martinez has predicted that a price rebound can be expected. However, a failure to maintain its current price could lead to further downsides, potentially pushing Bitcoin to its next critical support level.
BTC Market Top Set At $168,500In another more recent X post, Martinez presented a chart of Bitcoin’s price movements, predicting a market top above $168,500 based on the Mayer Multiple. The chart shows Bitcoin price performance based on the Mayer Multiple, which compares BTC to the 200-day Moving Average (MA).
The red line, as seen on the chart, indicates the Mayer MultipLe (MM) at 2.4, while the green line showcases MM at 0.8. Additionally, the blue line is the Oscillator, which tracks the Mayer Multiple over time.
Historically, the Bitcoin price tops have coincided with the Mayer Multiple reaching the 2.4 level or higher. Currently, Bitcoin’s Multiple Mayer sits at 1.3845 in the chart. However, if its price continues to rise and the MM reaches 2.4 again, Martinez predicts a market top above $168,500 for Bitcoin.
As of writing, Bitcoin’s price is $94,692, meaning a surge to $168,500 would require a significant 78% increase from its present market value.
Why this matters
This bitcoin story adds another data point to the current market tape and is useful when read alongside nearby source coverage.
Original source
Read on NewsBTCRelated market context

Bitcoin (BTC) Price Today: 2028 Halving Cycle and BlackRock ETF Inflow Signal Long-Term Rally
Recent market data also show that Bitcoin buyers have absorbed a key sell wall around $85,000, reducing one source of near-term re...

SEC signals more crypto proposals after custody rule overhaul
The SEC's ongoing crypto regulatory efforts could reshape asset custody norms, influencing market dynamics and compliance strategi...

Standard Chartered is building an institutional research universe for DeFi
Standard Chartered's DeFi research expansion signals a shift towards institutional-grade analysis, potentially accelerating DeFi's...

XRP Price, $300M ETF Demand, and 45% Q3 Supply Overhang
XRP price rose more than 45% in Q3 as U.S. spot XRP ETFs attracted about $307.9 million, yet the token entered October near $1.50...

Powerus tokenized stock PUSA hits $8 million in volume on Solana in four hours
The rapid trading volume of $PUSA on Solana highlights the growing appeal and potential of tokenized stocks for 24/7 global market...

SparkLend crosses 600,000 ETH in deposits, setting a new all-time high
SparkLend's milestone highlights growing trust in conservative DeFi protocols, potentially influencing future lending market dynam...