Bitcoin Price Grinds Higher, Why BTC Could Lift-off To $25K
Bitcoin price is gaining pace above $20,000 against the US Dollar. BTC is showing positive signs and might rise further towards $22,000 or even $25,000. Bitcoin is gaining pace above the $20,000 and $20,500 resistance le...
Archive context
Older archive item. Useful for background and entity history, but not a fresh market-moving signal.

Bitcoin price is gaining pace above $20,000 against the US Dollar. BTC is showing positive signs and might rise further towards $22,000 or even $25,000.
- Bitcoin is gaining pace above the $20,000 and $20,500 resistance levels.
- The price is trading above $20,000 and the 100 hourly simple moving average.
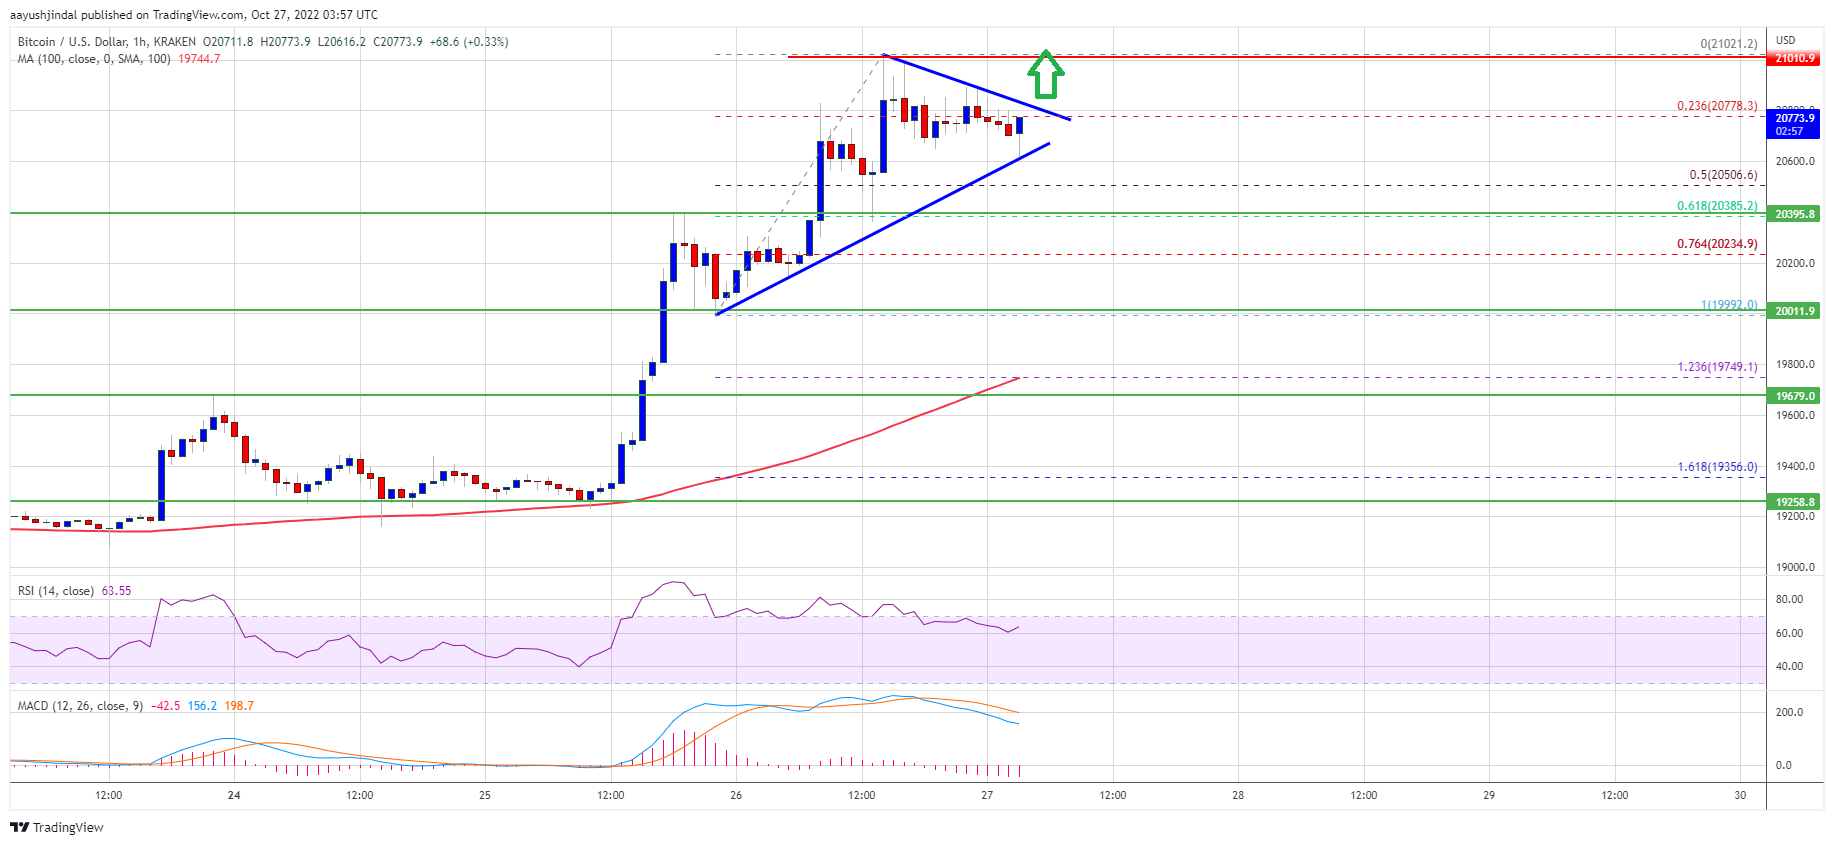
- There is a major contracting triangle forming with resistance near $20,820 on the hourly chart of the BTC/USD pair (data feed from Kraken).
- The pair could rally again if there is a clear move above the $21,200 resistance.
Bitcoin price started a fresh increase above the $19,650 and $20,000 resistance levels. BTC bulls were able to push the price into a positive zone above the $20,200 level.
Yesterday, we saw a bullish continuation pattern with resistance at $20,300. The price did move higher and cleared the $20,300 resistance. It even cleared the $20,500 resistance and settled well above the 100 hourly simple moving average.
A high was formed near $21,021 and the price is now consolidating gains. There was a minor decline below the $20,800 level. Bitcoin price dipped below the 23.6% Fib retracement level of the upward move from the $19,992 swing low to $21,021 high.
It is now trading above $20,000 and the 100 hourly simple moving average. There is also a major contracting triangle forming with resistance near $20,820 on the hourly chart of the BTC/USD pair.
Source: BTCUSD on TradingView.com
On the upside, an immediate resistance is near the $20,800 zone. The first major resistance sits near the $21,000 level. The next major resistance might be $21,200. A clear move above the $21,200 resistance might send the price towards the $22,000 resistance. Any more gains open the doors for a steady increase towards the $25,000 resistance zone.
Downside Correction in BTC?If bitcoin fails to rise above the $21,200 resistance zone, it could start a downside correction. An immediate support on the downside is near the $20,700 zone.
The next major support is near the $20,500 zone. It is near the 50% Fib retracement level of the upward move from the $19,992 swing low to $21,021 high. A downside break and close below $20,500 might clear the path for a test of the $20,000 zone.
Technical indicators:
Hourly MACD – The MACD is now gaining pace in the bullish zone.
Hourly RSI (Relative Strength Index) – The RSI for BTC/USD is now well above the 50 level.
Major Support Levels – $20,700, followed by $20,500.
Major Resistance Levels – $20,820, $21,200 and $22,000.
Why this matters
This bitcoin story adds another data point to the current market tape and is useful when read alongside nearby source coverage.
Original source
Read on NewsBTCRelated market context

Ethereum Research Thread Puts Sybil Resistance Back In Focus For Decentralized Networks
Ethereum Research Thread Puts Sybil Resistance Back In Focus For Decentralized Networks is a useful reminder that crypto coverage...

XRP’s $1 rebound faces holders trapped above $2
Glassnode reported that XRP holders who bought between 6 and 12 months ago have an average cost basis near $2.22, roughly 52% abov...

Ethereum Price Prediction: Robinhood Chain Leads Ethereum’s Biggest User Onboarding Wave
Price prediction debates are heating up as Ethereum trades at $1,790 and is slipping in trading volume. Still, Robinhood Chain kee...

Bitcoin (BTC) Price Prediction: $65.6K Liquidity Sweep Could Decide Whether BTC Retests $60K or Breaks Higher
While short-term technical indicators suggest buyers are attempting to regain momentum, traders remain cautious as mixed signals a...

XRP Price Prediction: Key Metrics Point to a Crash
XRP prediction chatter is heating up even as the price slips, which is usually when markets like to play tricks. XRP trades at aro...

SharpLink generates 499 Ethereum from staking rewards this week, total holdings near 888K ETH
SharpLink's strategic ETH accumulation and staking rewards enhance its market position, offering investors indirect Ethereum expos...