Bitcoin Price Grinds Lower And Seems Like Bears Are Not Done Yet
Bitcoin price is again moving lower below the $26,500 support. BTC remains at risk of more losses below the $26,000 support in the near term. Bitcoin started a fresh decline after it failed to clear the $27,500 resistanc...
Archive context
Older archive item. Useful for background and entity history, but not a fresh market-moving signal.

Bitcoin price is again moving lower below the $26,500 support. BTC remains at risk of more losses below the $26,000 support in the near term.
- Bitcoin started a fresh decline after it failed to clear the $27,500 resistance.
- The price is trading below $26,500 and the 100 hourly Simple moving average.
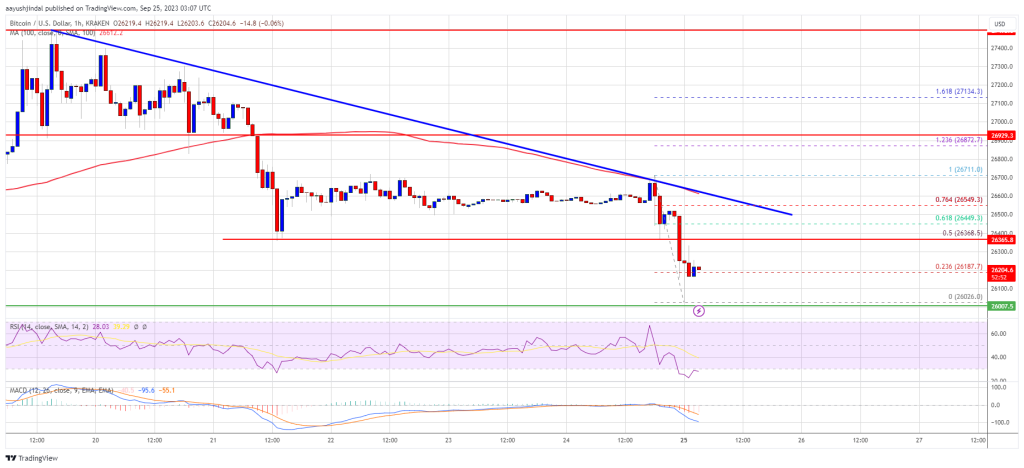
- There is a major bearish trend line forming with resistance near $26,500 on the hourly chart of the BTC/USD pair (data feed from Kraken).
- The pair is now at risk of more downsides below the $26,000 level.
Bitcoin price failed to clear the $27,500 resistance and started a fresh decline. BTC traded below the $27,000 and $26,500 support levels to enter a bearish zone.
There was also a move below the $26,200 support level. The price tested the $26,000 zone. A low was formed near $26,026 and the price is now consolidating losses. It is trading just above the 23.6% Fib retracement level of the recent decline from the $26,711 swing high to the $26,026 low.
Bitcoin is now trading below $26,500 and the 100 hourly Simple moving average. Immediate resistance on the upside is near the $26,350 level. The first major resistance is near the $26,500 zone, a connecting bearish trend line, and the 61.8% Fib retracement level of the recent decline from the $26,711 swing high to the $26,026 low.
Source: BTCUSD on TradingView.com
The next key resistance could be near the $26,700 level, above which the price could gain bullish momentum. In the stated case, the price could even rise toward the $27,000 resistance. Any more gains might call for a move toward the $27,500 level.
More Losses In BTC?If Bitcoin fails to start a fresh increase above the $26,500 resistance, it could continue to move down. Immediate support on the downside is near the $26,050 level.
The next major support is near the $26,000 level. A downside break and close below the $26,000 level might send the price further lower toward the next support at $25,400 in the coming sessions. Any more losses might call for a test of $25,000.
Technical indicators:
Hourly MACD – The MACD is now losing pace in the bearish zone.
Hourly RSI (Relative Strength Index) – The RSI for BTC/USD is now below the 50 level.
Major Support Levels – $26,000, followed by $25,400.
Major Resistance Levels – $26,350, $26,500, and $26,700.
Why this matters
This bitcoin story adds another data point to the current market tape and is useful when read alongside nearby source coverage.
Original source
Read on NewsBTCRelated market context

Bitcoin (BTC) Price Prediction: $65K Remains Key Resistance as 4-Year Cycle Model Signals Make-or-Break Moment
The Bitcoin price today remains around $62,600-$62,900, according to TradingView data, reflecting a market that has stabilized fol...

XRP Price Prediction: Analyst Maps Rally to $2.55 as Macro Accumulation Zone Holds
While current market indicators point to limited momentum, several chart analysts argue that the XRP price remains within a histor...

Litecoin (LTC) Price Prediction: Mixed Technical Signals and Growing Hashrate Keep Traders Focused on $39 Support and $46 Breakout
Analysts are closely watching whether the Litecoin price can maintain support around $39 and break above the key $46 resistance le...

Bitcoin’s $10 billion credit market keeps growing after its first major selloff
Bitcoin’s more than $10 billion corporate credit market is still attracting new entrants after a June selloff triggered margin cal...

Dogecoin Traders Watch $0.13 As DOGE Reclaims A Key Technical Level
Dogecoin Traders Watch $0.13 as DOGE Reclaims A Key Technical Level is the kind of crypto story that looks simple at headline leve...

Bitcoin Price Prediction: Overlooked Indicator Gives the Bear Market 3 Months Left
Bitcoin is trading near $62,950 after gaining about 1.7% over the past 24 hours, but the latest price prediction is looking well b...