Bitcoin Price Grinds Lower, Why The Bears Are Not Done Yet
Bitcoin price is slowly moving lower towards $15,500. BTC remains at a risk of more losses unless it settles above the $17,000 resistance zone. Bitcoin started a fresh decline below the $16,500 and $16,400 levels. The pr...
Archive context
Older archive item. Useful for background and entity history, but not a fresh market-moving signal.

Bitcoin price is slowly moving lower towards $15,500. BTC remains at a risk of more losses unless it settles above the $17,000 resistance zone.
- Bitcoin started a fresh decline below the $16,500 and $16,400 levels.
- The price is trading below $16,500 and the 100 hourly simple moving average.
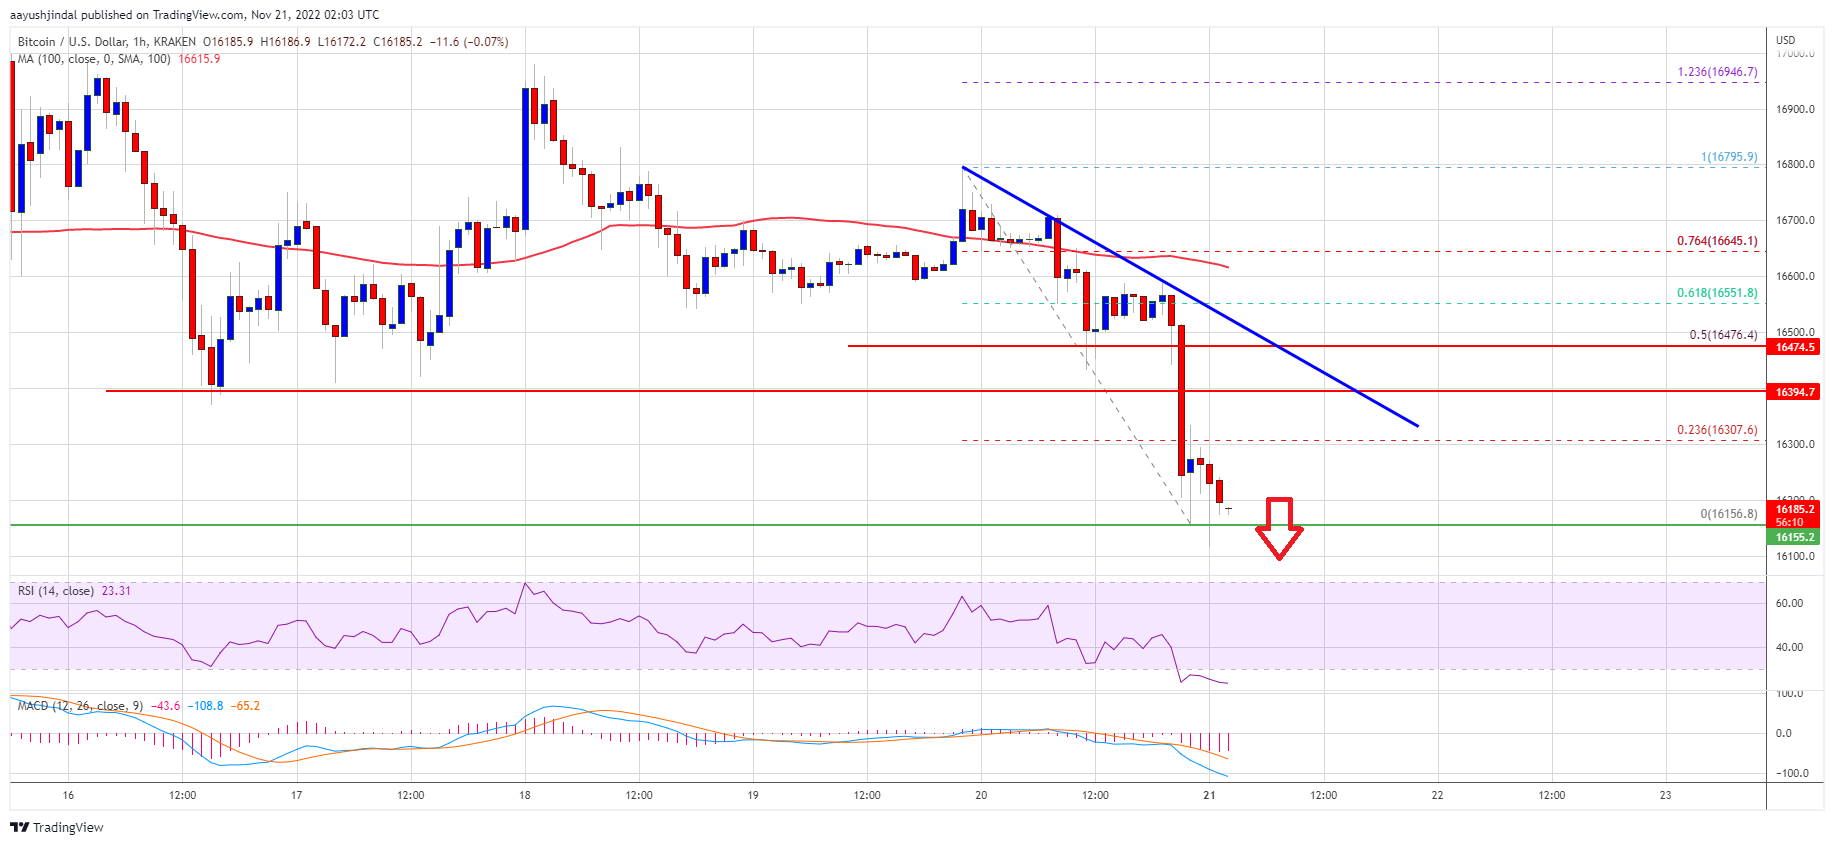
- There is a key bearish trend line forming with resistance near $16,390 on the hourly chart of the BTC/USD pair (data feed from Kraken).
- The pair could start a decent increase if there is a move above the $16,500 resistance zone.
Bitcoin price failed to gain pace above the $17,000 resistance. BTC struggled to stay above the $16,650 level and started a fresh decline.
The recent swing high was formed near $16,795 before the price dropped below the $16,500 support. There was a close below the $16,500 zone and the 100 hourly simple moving average. The bears even pushed the price towards the $16,150 level.
A low is formed near $16,156 and the price is now consolidating losses. On the upside, an immediate resistance is near the $16,300 level. It is near the 23.6% Fib retracement level of the recent decline from the $16,795 swing high to $16,156 low.
The first major resistance is near the $16,400 zone. There is also a key bearish trend line forming with resistance near $16,390 on the hourly chart of the BTC/USD pair. The next major resistance is near the $16,500 level. It is near the 50% Fib retracement level of the recent decline from the $16,795 swing high to $16,156 low.
Source: BTCUSD on TradingView.com
Bitcoin price must clear the trend line resistance and then the 100 hourly simple moving average to move into a positive zone. The next major resistance is near $17,000, above which the price could gain pace for a move towards the $18,000 zone.
More Losses in BTC?If bitcoin fails to gain pace above the $16,400 resistance zone, it could continue to move down. An immediate support on the downside is near the $16,150 level.
The next major support is near the $16,000 zone, below which the price might test the key support at $15,500. A clear move below the $15,500 support might send the price further lower.
Technical indicators:
Hourly MACD – The MACD is now gaining pace in the bearish zone.
Hourly RSI (Relative Strength Index) – The RSI for BTC/USD is now in the oversold zone.
Major Support Levels – $16,150, followed by $16,000.
Major Resistance Levels – $16,350, $16,400 and $16,500.
Why this matters
This bitcoin story adds another data point to the current market tape and is useful when read alongside nearby source coverage.
Original source
Read on NewsBTCRelated market context

XRP’s $1 rebound faces holders trapped above $2
Glassnode reported that XRP holders who bought between 6 and 12 months ago have an average cost basis near $2.22, roughly 52% abov...

Bitcoin pushes toward $65,000 on US inflation relief that may already be fading
Bitcoin approached $65,000 on July 14 as a sharper-than-expected slowdown in US inflation weakened the case for another near-term...

Bitcoin Price Jumps Above $64,000 as Cooler-Than-Expected Inflation Strengthens the Case for Rate Cuts
Bitcoin Magazine Bitcoin Price Jumps Above $64,000 as Cooler-Than-Expected Inflation Strengthens the Case for Rate Cuts Bitcoin pr...

South Korea’s 8% stock crash set up a crypto rotation but Upbit volume rose just 4%
Crypto and tokenized assets appear to be finding their way into all aspects of finance at the moment. However, when South Korea's...

June CPI Beat Sparks Bitcoin Surge, but the Fed’s September Hike Looms
June CPI fell a seasonally adjusted 0.4% month-over-month, the steepest monthly drop since April 2020, pulling the annual inflatio...

XRP Price Prediction: Key Metrics Point to a Crash
XRP prediction chatter is heating up even as the price slips, which is usually when markets like to play tricks. XRP trades at aro...