Bitcoin Price Hints at Downside: Preparing for Potential Declines
Bitcoin price corrected gained from the $66,000 resistance level. BTC dipped below $64,000 and might extend losses in the short term. Bitcoin started a fresh downside correction from the $66,000 resistance zone. The pric...
Archive context
Older archive item. Useful for background and entity history, but not a fresh market-moving signal.

Bitcoin price corrected gained from the $66,000 resistance level. BTC dipped below $64,000 and might extend losses in the short term.
- Bitcoin started a fresh downside correction from the $66,000 resistance zone.
- The price is trading below $64,500 and the 100 hourly Simple moving average.
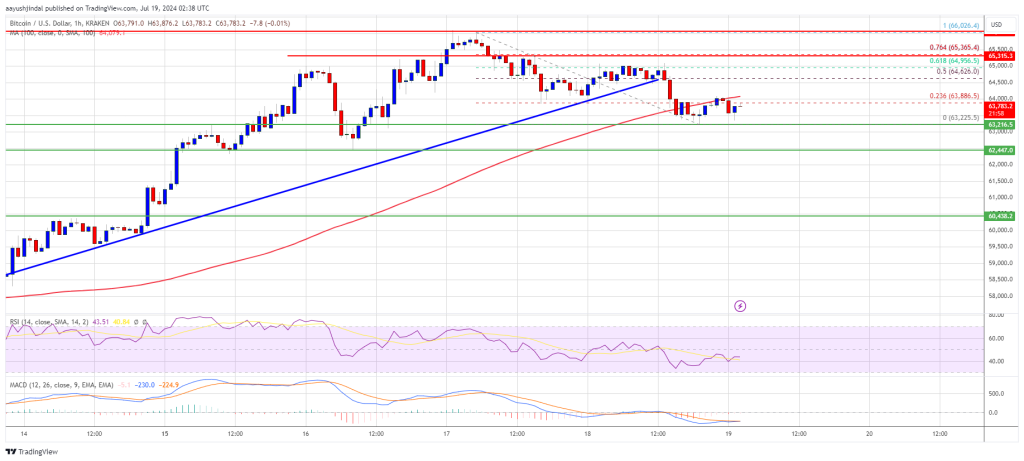
- There was a break below a key bullish trend line with support at $64,500 on the hourly chart of the BTC/USD pair (data feed from Kraken).
- The pair might gain bearish momentum if it dives below the $62,500 support zone.
Bitcoin price failed to extend gains above the $65,500 and $66,000 resistance levels. BTC started a downside correction and traded below the $65,000 level.
There was a break below a key bullish trend line with support at $64,500 on the hourly chart of the BTC/USD pair. The bears pushed the price below the $64,000 level. A low is formed at $63,225 and the price is consolidating losses.
It is testing the 23.6% Fib retracement level of recent decline from the $66,026 swing high to the $63,225 low. Bitcoin price is now trading below $64,500 and the 100 hourly Simple moving average. If there is a fresh increase, the price could face resistance near the $64,000 level.
The first key resistance is near the $64,650 level. It is near the 50% Fib retracement level of recent decline from the $66,026 swing high to the $63,225 low. A clear move above the $64,650 resistance might spark another increase in the coming sessions.
The next key resistance could be $65,500. The next major hurdle sits at $66,000. A close above the $66,000 resistance might push the price further higher. In the stated case, the price could rise and test the $67,200 resistance.
More Downsides In BTC?If Bitcoin fails to climb above the $64,650 resistance zone, it could continue to move down. Immediate support on the downside is near the $63,250 level.
The first major support is $63,000. The next support is now near $62,500. Any more losses might send the price toward the $60,500 support zone in the near term.
Technical indicators:
Hourly MACD – The MACD is now gaining pace in the bearish zone.
Hourly RSI (Relative Strength Index) – The RSI for BTC/USD is now below the 50 level.
Major Support Levels – $63,225, followed by $63,000.
Major Resistance Levels – $64,650, and $65,500.
Why this matters
This bitcoin story adds another data point to the current market tape and is useful when read alongside nearby source coverage.
Original source
Read on NewsBTCRelated market context

Ethereum (ETH) Price Prediction: ETH Holds Near $1,780 as Bulls Eye $1,860–$1,950, but $1,609 Remains Key Invalidation
Ethereum price is trading near $1,779 after a mixed 24-hour session, according to Brave New Coin data. ETH is down around 0.76% on...

Bitcoin (BTC) Price Prediction: BTC Holds $63K Support—Can Rising Active Addresses Offset Bearish Technical Signals?
Although the BTC price has remained near a key support zone, recent chart signals and Strategy’s sale of a portion of its Bitcoin...

XRP Price Prediction: Volume and ETF Inflow Send Ripple Token Higher
XRP price pushed above the $1.14 resistance area after buyers stepped in with heavy volume and bullish prediction. The token climb...

Bitcoin Price Prediction: Peter Brandt Might Dump BTC for Gold
Bitcoin is facing a test, and its price prediction is not helping. So far in 2026, BTC has fallen about 28%, while gold is down ju...

Bitcoin miner bottom signal now depends on who survives weak mining profits
A Bitcoin miner-stress signal circulating on X has fallen into a zone analysts associate with severe miner pressure, putting a fam...

Vitalik Buterin Says Ethereum’s Next Major Upgrade Will Take Three to Four Years and Rival the Merge
Ethereum co-founder Vitalik Buterin says the network’s next major overhaul, an initiative researchers are calling “Lean Ethereum,”...