Bitcoin Price Hints At Potential Correction, But Can BTC Clear This Hurdle?
Bitcoin price started an upside correction from the $26,550 zone. BTC is rising and facing a strong resistance near the $27,300 and $27,500 levels. Bitcoin managed to recover above the $27,000 resistance zone. The price...
Archive context
Older archive item. Useful for background and entity history, but not a fresh market-moving signal.

Bitcoin price started an upside correction from the $26,550 zone. BTC is rising and facing a strong resistance near the $27,300 and $27,500 levels.
- Bitcoin managed to recover above the $27,000 resistance zone.
- The price is trading above $27,000 and the 100 hourly Simple moving average.
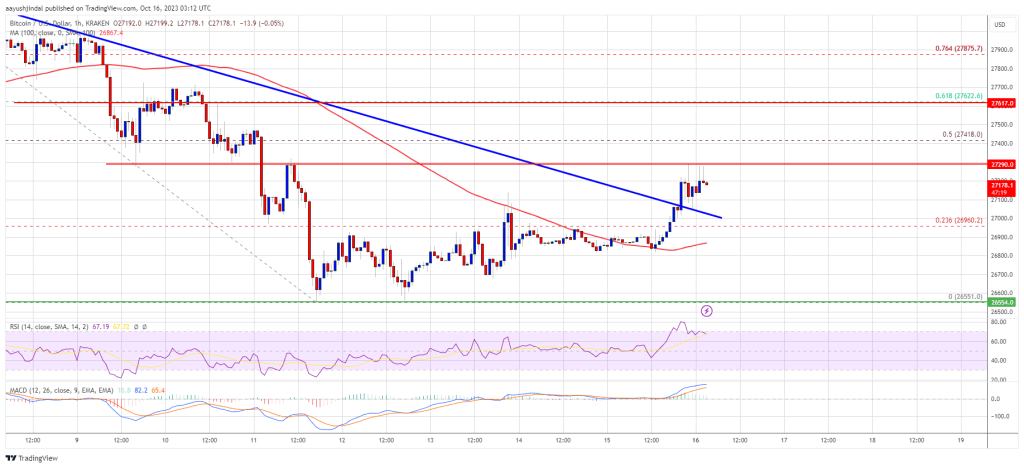
- There was a break above a major bearish trend line with resistance near $27,000 on the hourly chart of the BTC/USD pair (data feed from Kraken).
- The pair is showing signs of a recovery, but it could struggle near $27,300 and $27,500.
Bitcoin price found support near the $26,550 level. BTC bears attempted to clear $26,550, but they failed. As a result, the price started an upside correction above the $26,800 resistance.
There was a move above the 23.6% Fib retracement level of the downward move from the $28,285 swing high to the $26,550 low. Besides, there was a break above a major bearish trend line with resistance near $27,000 on the hourly chart of the BTC/USD pair.
Bitcoin is now trading above $27,000 and the 100 hourly Simple moving average. It seems like the price is facing a strong resistance near the $27,300 level.
The next key resistance could be near $27,500 or the 61.8% Fib retracement level of the downward move from the $28,285 swing high to the $26,550 low. A clear move above the $27,500 and $27,650 resistance levels could set the pace for a larger increase.
Source: BTCUSD on TradingView.com
The next key resistance could be $28,000. A close above the $28,000 resistance might start a steady increase toward the $28,500 level. Any more gains might send BTC toward the $29,200 level.
Another Decline In BTC?If Bitcoin fails to recover higher above the $27,500 resistance, there could be a fresh decline. Immediate support on the downside is near the $27,000 level and the trend line zone.
The next major support is near the $26,900 level and the 100 hourly Simple moving average. A downside break and close below the $26,900 support might send the price further lower. The next support sits at $26,550.
Technical indicators:
Hourly MACD – The MACD is now losing pace in the bullish zone.
Hourly RSI (Relative Strength Index) – The RSI for BTC/USD is now above the 50 level.
Major Support Levels – $27,000, followed by $26,900.
Major Resistance Levels – $27,300, $27,500, and $27,650.
Why this matters
This bitcoin story adds another data point to the current market tape and is useful when read alongside nearby source coverage.
Original source
Read on NewsBTCRelated market context

Bitcoin (BTC) Price Prediction: $65K Remains Key Resistance as 4-Year Cycle Model Signals Make-or-Break Moment
The Bitcoin price today remains around $62,600-$62,900, according to TradingView data, reflecting a market that has stabilized fol...

Ethereum Price Prediction: Tom Lee Predicts $5 Trillion Ethereum
Ethereum price prediction is back in focus after Fundstrat co-founder Tom Lee floated a $5 trillion network valuation. ETH trades...

Litecoin (LTC) Price Prediction: Mixed Technical Signals and Growing Hashrate Keep Traders Focused on $39 Support and $46 Breakout
Analysts are closely watching whether the Litecoin price can maintain support around $39 and break above the key $46 resistance le...

SWIFT Crypto Ledger Targets Settlement Dead Zones With 17-Bank Go-Live
SWIFT is taking its biggest step into crypto after confirming its blockchain-based shared ledger is ready for initial use. Built o...

XRP Price Prediction: Judge in XRP Ruling Delivers Fresh Blow
Federal Judge Analisa Torres, the architect of XRP’s landmark 2023 securities ruling, has handed down another closely watched deci...

Cardano’s wallet hack exposed the user layer holding its on-chain government together
EMURGO said it is stepping down from its role in Pentad, the five-member group coordinating Cardano's infrastructure funding, to f...