Bitcoin Price Holds Steady — Bullish Monthly Structure Suggests Rally Continuation
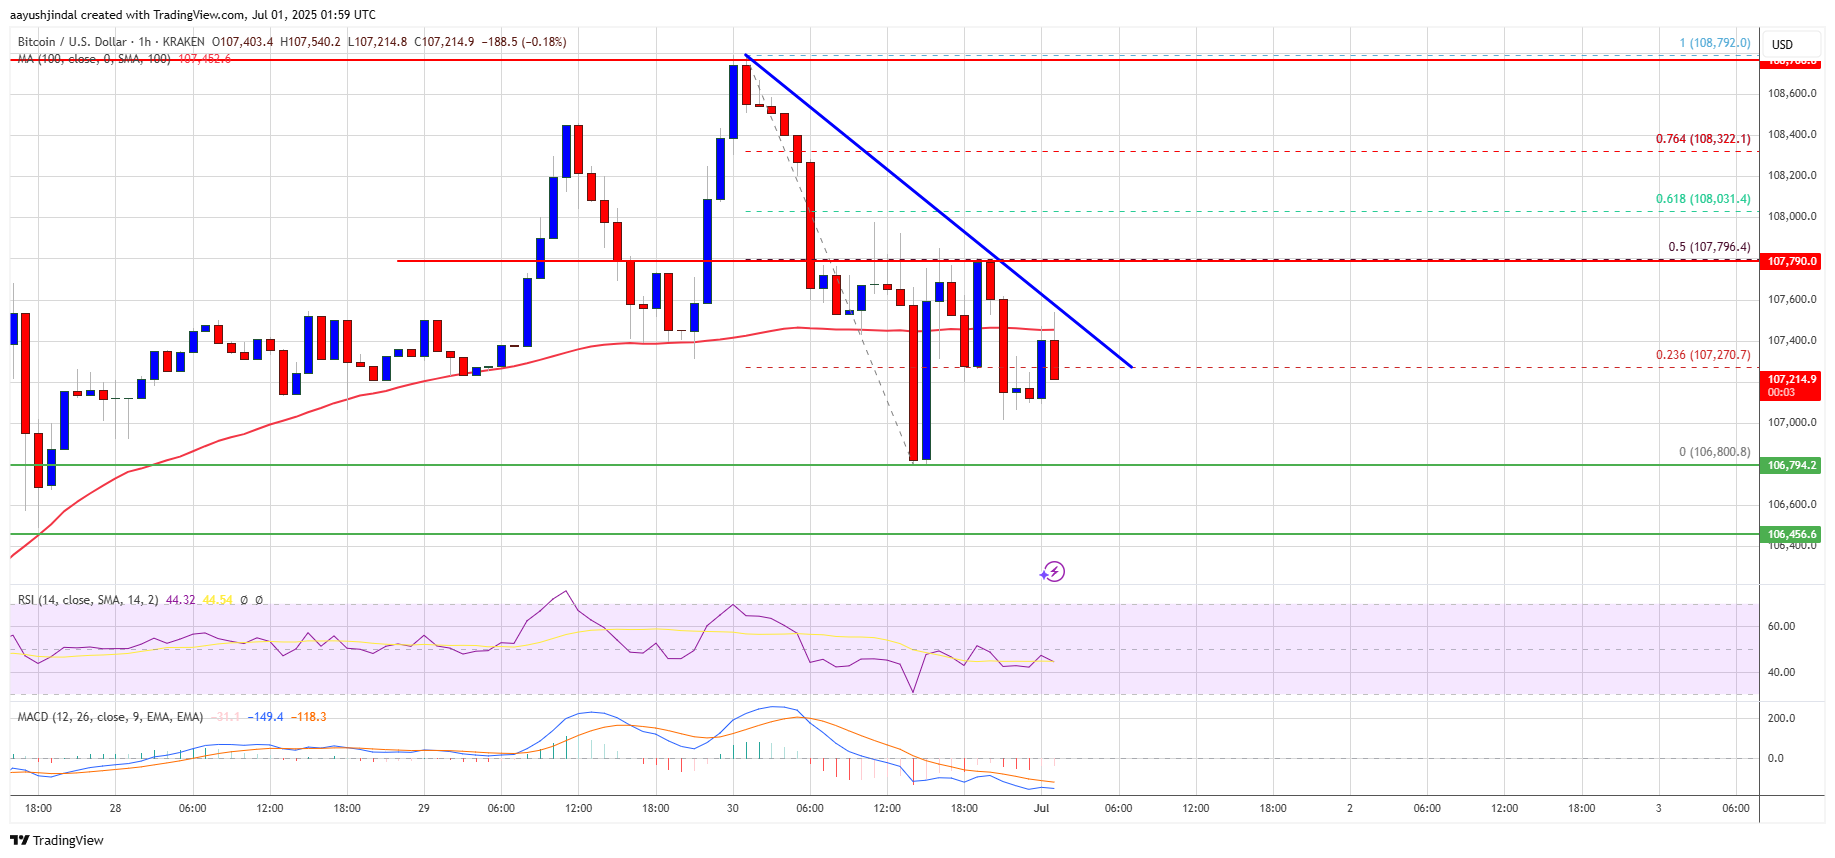
Bitcoin price started trading in a range below the $108,800 zone. BTC is now consolidating and might aim for a move above the $108,000 resistance. Bitcoin started a downside correction from the $108,800 zone. The price i...
Archive context
Older archive item. Useful for background and entity history, but not a fresh market-moving signal.

Bitcoin price started trading in a range below the $108,800 zone. BTC is now consolidating and might aim for a move above the $108,000 resistance.
- Bitcoin started a downside correction from the $108,800 zone.
- The price is trading below $107,500 and the 100 hourly Simple moving average.
- There is a bearish trend line forming with resistance at $107,400 on the hourly chart of the BTC/USD pair (data feed from Kraken).
- The pair could start a fresh increase if it stays above the $105,500 zone.
Bitcoin price started a fresh increase above the $105,500 zone. BTC gained pace and was able to climb above the $106,500 and $107,200 levels to enter a positive zone.
The bulls pushed the price above the $108,000 resistance and the price tested the $108,800 zone. A high was formed at $108,792 and the price recently corrected gains. There was a move below the $107,500 level. A low was formed at $106,800 and the price is now consolidating losses.
There was a recovery above the 23.6% Fib retracement level of the downward move from the $108,792 swing high to the $106,800 low. Bitcoin is now trading below $107,500 and the 100 hourly Simple moving average.
On the upside, immediate resistance is near the $107,400 level. There is also a bearish trend line forming with resistance at $107,400 on the hourly chart of the BTC/USD pair. The first key resistance is near the $108,000 level and the 50% Fib level of the downward move from the $108,792 swing high to the $106,800 low.
A close above the $108,000 resistance might send the price further higher. In the stated case, the price could rise and test the $108,800 resistance level. Any more gains might send the price toward the $110,000 level.
More Losses In BTC?If Bitcoin fails to rise above the $108,000 resistance zone, it could start another decline. Immediate support is near the $106,800 level. The first major support is near the $106,500 level.
The next support is now near the $105,500 zone. Any more losses might send the price toward the $105,000 support in the near term. The main support sits at $103,500, below which BTC might gain bearish momentum.
Technical indicators:
Hourly MACD – The MACD is now losing pace in the bearish zone.
Hourly RSI (Relative Strength Index) – The RSI for BTC/USD is now below the 50 level.
Major Support Levels – $106,800, followed by $106,500.
Major Resistance Levels – $108,000 and $108,800.
Why this matters
This bitcoin story adds another data point to the current market tape and is useful when read alongside nearby source coverage.
Original source
Read on NewsBTCRelated market context

Bitcoin (BTC) Price Prediction: BTC Holds $63K Support—Can Rising Active Addresses Offset Bearish Technical Signals?
Although the BTC price has remained near a key support zone, recent chart signals and Strategy’s sale of a portion of its Bitcoin...

Bitcoin Price Prediction: Peter Brandt Might Dump BTC for Gold
Bitcoin is facing a test, and its price prediction is not helping. So far in 2026, BTC has fallen about 28%, while gold is down ju...

XRP Price Prediction: Volume and ETF Inflow Send Ripple Token Higher
XRP price pushed above the $1.14 resistance area after buyers stepped in with heavy volume and bullish prediction. The token climb...

Ethereum Price Prediction: Vitalik Hints at 3-4 Years Long ETH Rebuild
Ethereum price is trading at $1,780 as Vitalik Buterin revealed the network’s biggest roadmap since the Merge, which somehow sends...

Sui DeFi TVL Breaks $1 Billion As Move-Based Chains Fight For Liquidity
Sui has crossed the $1 billion total value locked mark on DeFiLlama, giving the Move-based network a clearer claim to serious DeFi...

Dormant $1.9M Bitcoin tied to New York lawsuit moves after nearly 15 years
A Bitcoin address dormant for nearly 15 years moved $1.9 million in BTC as a New York lawsuit seeks ownership of thousands of inac...