Bitcoin Price Holds Strong At $30K: Indicators Point To More Upsides To $31.2K
Bitcoin price is gaining pace above the $30,000 resistance. BTC is showing positive signs and might rally further above toward the $31,200 level. Bitcoin started a fresh increase above the $28,500 and $28,800 resistance...
Archive context
Older archive item. Useful for background and entity history, but not a fresh market-moving signal.

Bitcoin price is gaining pace above the $30,000 resistance. BTC is showing positive signs and might rally further above toward the $31,200 level.
- Bitcoin started a fresh increase above the $28,500 and $28,800 resistance levels.
- The price is trading above $30,000 and the 100 hourly Simple moving average.
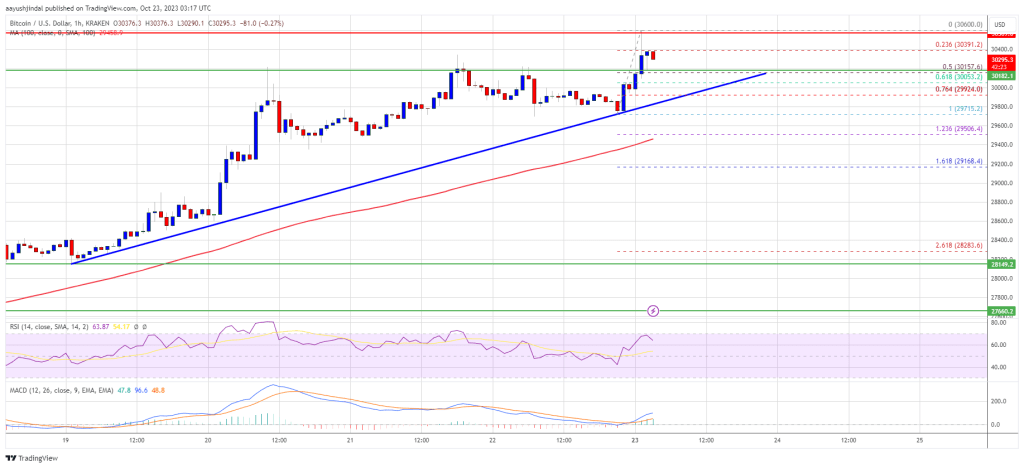
- There is a key bullish trend line forming with support near $30,000 on the hourly chart of the BTC/USD pair (data feed from Kraken).
- The pair could continue to rise toward the $31,200 resistance level.
Bitcoin price formed a support base above the $27,500 level. BTC started a steady increase and cleared a few hurdles near the $28,500 resistance zone.
The bulls gained strength and managed to push the price above the main $30,000 resistance zone. A new multi-week high is formed near $30,600 and the price is now consolidating gains. There was a minor decline below the 23.6% Fib retracement level of the upward move from the $29,715 swing low to the $30,600 high.
Bitcoin is now trading above $30,000 and the 100 hourly Simple moving average. There is also a key bullish trend line forming with support near $30,000 on the hourly chart of the BTC/USD pair. The trend line is near the 61.8% Fib retracement level of the upward move from the $29,715 swing low to the $30,600 high.
Source: BTCUSD on TradingView.com
On the upside, immediate resistance is near the $30,400 level. The next key resistance could be near $30,600. A clear move above the recent high might send the price toward the $31,200 resistance. The next key resistance could be $32,000. Any more gains might send BTC toward the $33,200 level in the coming sessions.
Are Dips Limited In BTC?If Bitcoin fails to rise above the $30,600 resistance zone, it could start a downside correction. Immediate support on the downside is near the $30,150 level.
The next major support is near the $30,000 level and the trend line. If there is a move below the trend line support, the price may perhaps decline toward the $29,500 level or the 100 hourly Simple moving average.
Technical indicators:
Hourly MACD – The MACD is now gaining pace in the bullish zone.
Hourly RSI (Relative Strength Index) – The RSI for BTC/USD is now above the 50 level.
Major Support Levels – $30,150, followed by $30,000.
Major Resistance Levels – $30,400, $30,600, and $31,200.
Why this matters
This bitcoin story adds another data point to the current market tape and is useful when read alongside nearby source coverage.
Original source
Read on NewsBTCRelated market context

Ethereum Price Prediction: Tom Lee Predicts $5 Trillion Ethereum
Ethereum price prediction is back in focus after Fundstrat co-founder Tom Lee floated a $5 trillion network valuation. ETH trades...

Litecoin (LTC) Price Prediction: Mixed Technical Signals and Growing Hashrate Keep Traders Focused on $39 Support and $46 Breakout
Analysts are closely watching whether the Litecoin price can maintain support around $39 and break above the key $46 resistance le...

Bitcoin Price Prediction: Overlooked Indicator Gives the Bear Market 3 Months Left
Bitcoin is trading near $62,950 after gaining about 1.7% over the past 24 hours, but the latest price prediction is looking well b...

XRP Price Prediction: Judge in XRP Ruling Delivers Fresh Blow
Federal Judge Analisa Torres, the architect of XRP’s landmark 2023 securities ruling, has handed down another closely watched deci...

SWIFT Crypto Ledger Targets Settlement Dead Zones With 17-Bank Go-Live
SWIFT is taking its biggest step into crypto after confirming its blockchain-based shared ledger is ready for initial use. Built o...

JPMorgan’s $4.7T private blockchain warning just gave Bitcoin bulls fresh ammunition
JPMorgan sees Wall Street’s shift toward private blockchains as a deeper threat to Bitcoin than Strategy selling its BTC. JPMorgan...