Bitcoin Price Just Saw Technical Correction And Fresh Increase Seems Likely
Bitcoin price corrected lower from $19,650 against the US Dollar. BTC is holding the $19,200 support and might soon start a fresh increase. Bitcoin started a downside correction after it failed to clear the $19,650 zone....
Archive context
Older archive item. Useful for background and entity history, but not a fresh market-moving signal.

Bitcoin price corrected lower from $19,650 against the US Dollar. BTC is holding the $19,200 support and might soon start a fresh increase.
- Bitcoin started a downside correction after it failed to clear the $19,650 zone.
- The price is trading above $19,200 and the 100 hourly simple moving average.
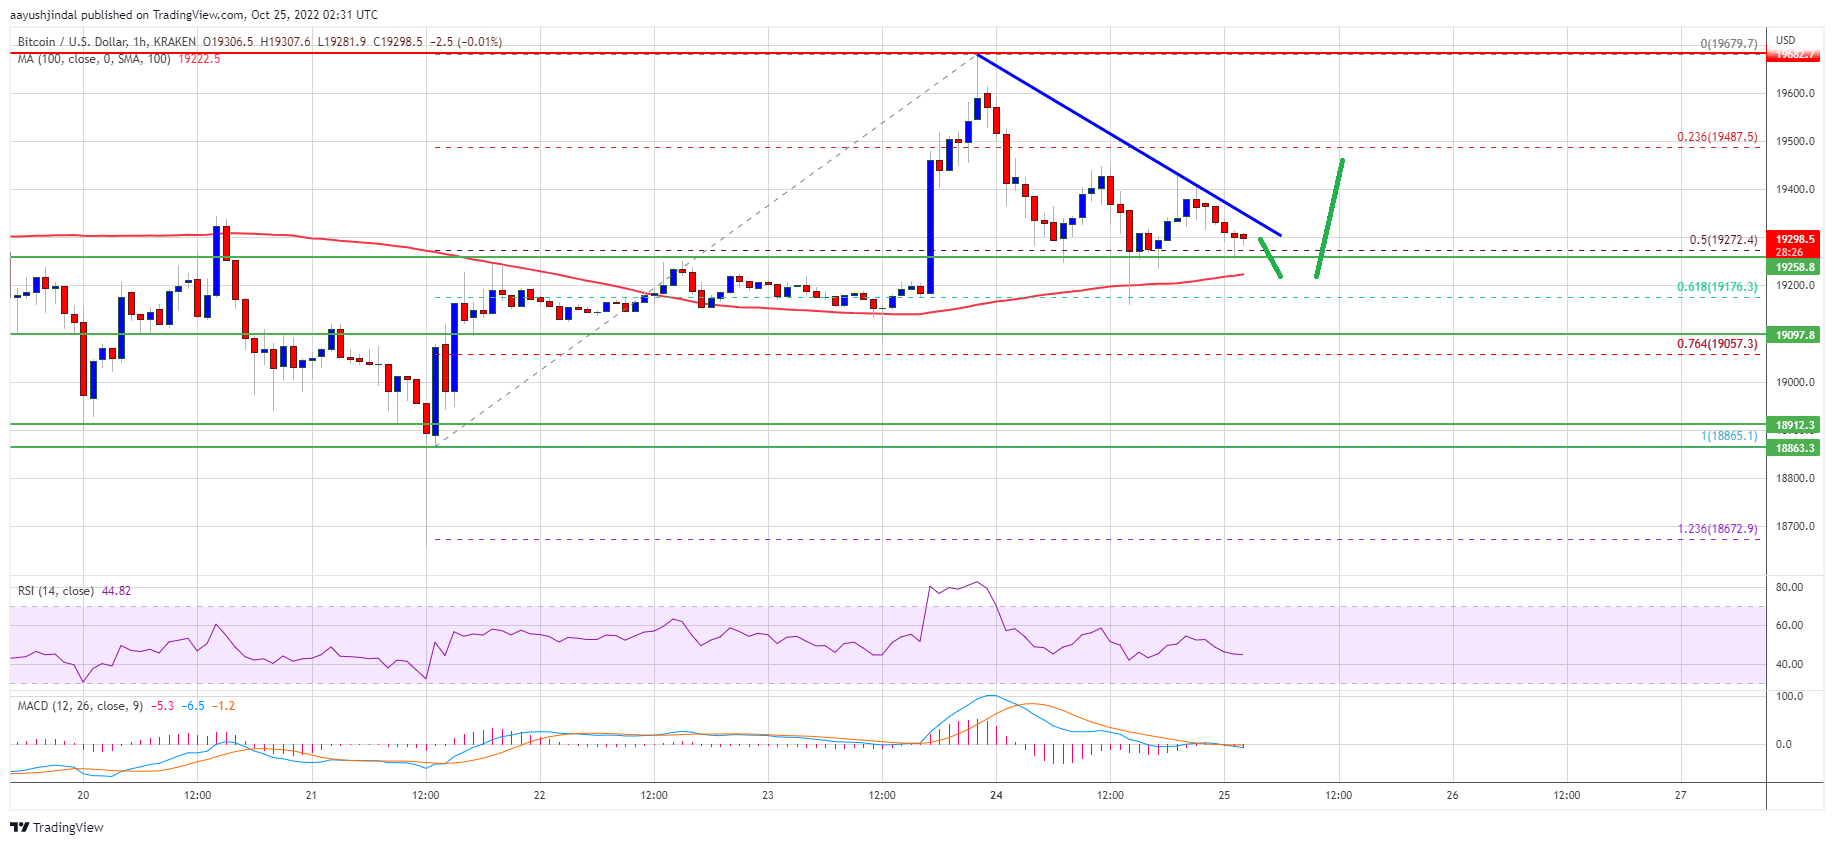
- There is a connecting bearish trend line forming with resistance near $19,320 on the hourly chart of the BTC/USD pair (data feed from Kraken).
- The pair could start a fresh increase if there is a clear move above the $19,350 resistance.
Bitcoin price was able to gain pace for a move above the $19,500 resistance. However, BTC struggled above the $19,600 zone. It traded as high as $19,679 and recently started a downside correction.
There was a correction below the $19,500 and $19,400 levels. The price declined below the 23.6% Fib retracement level of the key increase from the $18,865 swing low to $19,680 high. The price even spiked below the $19,250 level.
However, the bulls were active near the $19,200 support zone. Bitcoin price is now trading above $19,200 and the 100 hourly simple moving average. It is also stable above the 50% Fib retracement level of the key increase from the $18,865 swing low to $19,680 high.
On the upside, an immediate resistance is near the $19,320 level. There is also a connecting bearish trend line forming with resistance near $19,320 on the hourly chart of the BTC/USD pair.
Source: BTCUSD on TradingView.com
The first major resistance sits near the $19,500 level. The next major resistance might be $19,650. A clear move above the $19,650 resistance might send the price towards the $20,000 resistance. Any more gains might set the pace for a steady increase towards the $21,200 resistance zone.
Dips Limited in BTC?If bitcoin fails to rise above the $19,500 resistance zone, it could continue to move down. An immediate support on the downside is near the $19,270 zone.
The next major support is near the $19,200 zone and the 100 hourly simple moving average. A downside break and close below $19,200 might open the doors for a fresh test of the $18,800 support.
Technical indicators:
Hourly MACD – The MACD is now losing pace in the bullish zone.
Hourly RSI (Relative Strength Index) – The RSI for BTC/USD is now below the 50 level.
Major Support Levels – $19,270, followed by $19,200.
Major Resistance Levels – $19,320, $19,500 and $19,650.
Why this matters
This bitcoin story adds another data point to the current market tape and is useful when read alongside nearby source coverage.
Original source
Read on NewsBTCRelated market context

Bitcoin (BTC) Price Prediction: $65.6K Liquidity Sweep Could Decide Whether BTC Retests $60K or Breaks Higher
While short-term technical indicators suggest buyers are attempting to regain momentum, traders remain cautious as mixed signals a...

XRP’s $1 rebound faces holders trapped above $2
Glassnode reported that XRP holders who bought between 6 and 12 months ago have an average cost basis near $2.22, roughly 52% abov...

Bitcoin pushes toward $65,000 on US inflation relief that may already be fading
Bitcoin approached $65,000 on July 14 as a sharper-than-expected slowdown in US inflation weakened the case for another near-term...

Bitcoin Price Jumps Above $64,000 as Cooler-Than-Expected Inflation Strengthens the Case for Rate Cuts
Bitcoin Magazine Bitcoin Price Jumps Above $64,000 as Cooler-Than-Expected Inflation Strengthens the Case for Rate Cuts Bitcoin pr...

Bitcoin Price Prediction: Strategy Has a New BTC Approach
Bitcoin price is trading at $62,900, as we debate whether this pause is simply a reset or something more serious, with bearish pre...

Ethereum (ETH) Price Prediction: ETH Eyes $2,100 as ETF Inflows Return and Whale Demand Builds
Ethereum price is trading near $1,785 after a modest 24-hour recovery, but the market is now watching whether fresh inflows and wh...