Bitcoin Price Just Saw Technical Correction But Key Uptrend Support Intact
Bitcoin price started a downside correction below $23,000. BTC is testing an important support and might start a fresh increase towards $23,500. Bitcoin started a downside correction and declined below the $23,000 suppor...
Archive context
Older archive item. Useful for background and entity history, but not a fresh market-moving signal.

Bitcoin price started a downside correction below $23,000. BTC is testing an important support and might start a fresh increase towards $23,500.
- Bitcoin started a downside correction and declined below the $23,000 support zone.
- The price is trading below $23,000 and the 100 hourly simple moving average.
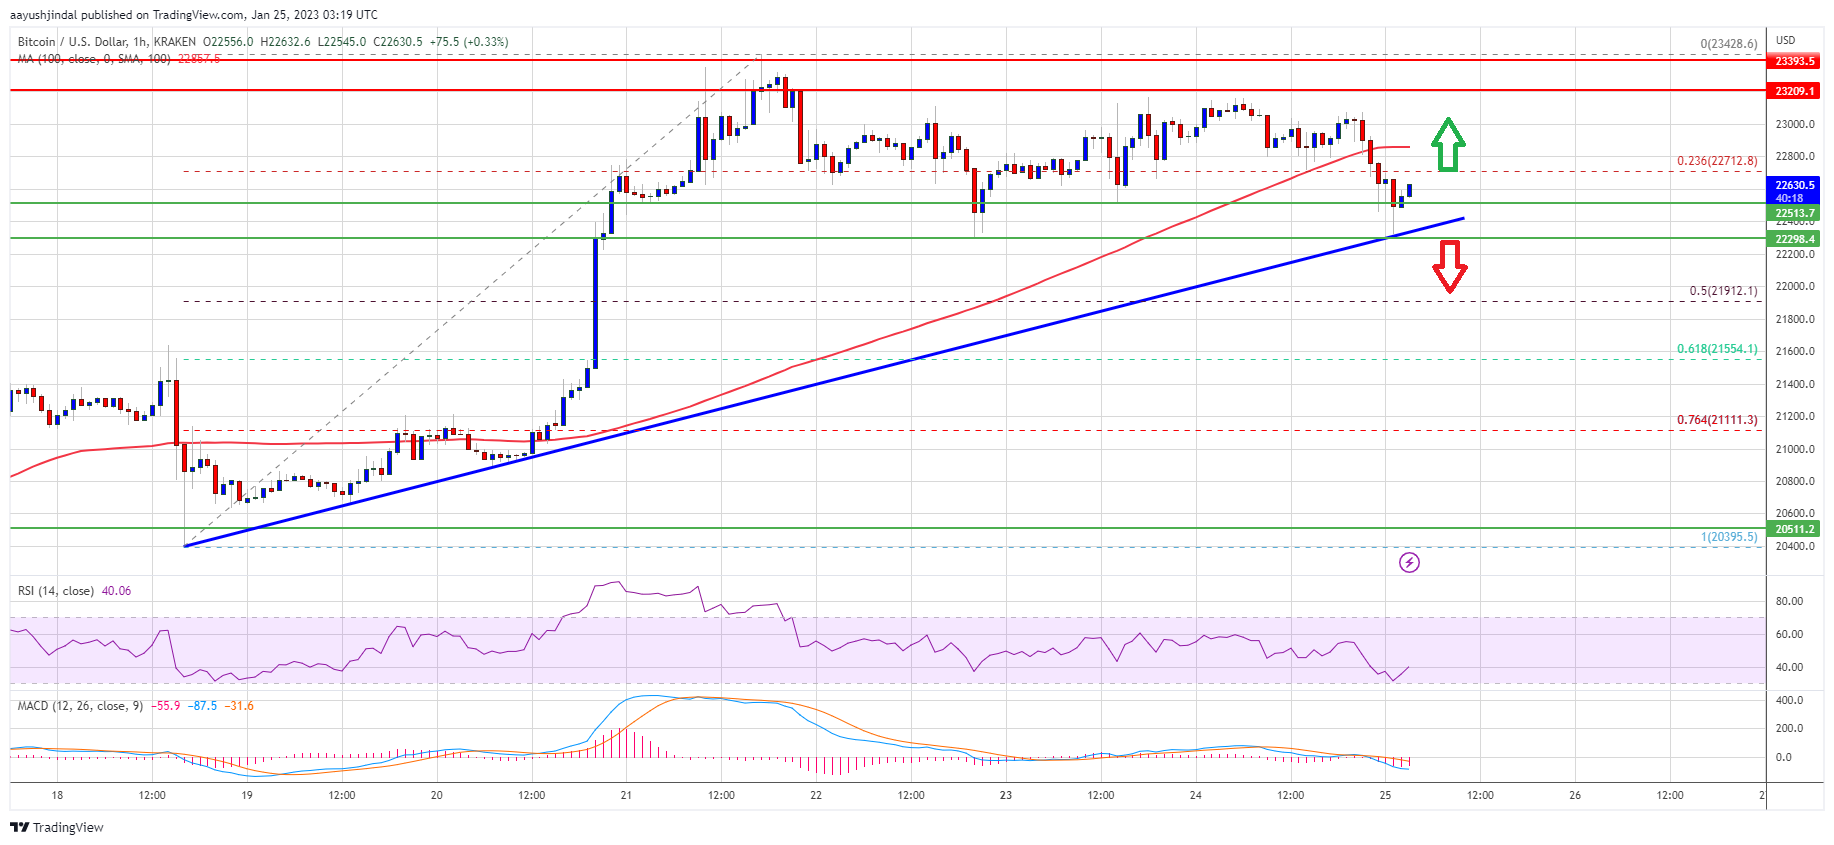
- There is a major bullish trend line forming with support near $22,400 on the hourly chart of the BTC/USD pair (data feed from Kraken).
- The pair could start a fresh increase if it stays above the $22,000 support zone.
Bitcoin price struggled to clear the $23,400 and $23,500 resistance levels. BTC started a downside correction and traded below the $23,000 support zone.
The price declined below the 23.6% Fib retracement level of the key increase from the $20,395 swing low to $24,250 high. The price even spiked below the $22,500 support level. However, the bulls appeared near the $22,200 support zone.
There is also a major bullish trend line forming with support near $22,400 on the hourly chart of the BTC/USD pair. Bitcoin price is now trading below $23,000 and the 100 hourly simple moving average.
An immediate resistance is near the $22,700 level. The next major resistance is near the $22,850 zone or the 100 hourly simple moving average, above which the price might gain bullish momentum. In the stated case, the price may perhaps rise towards the $23,200 level.
Source: BTCUSD on TradingView.com
The next resistance could be near the $23,500 level. Any more gains might send btc price towards the $24,200 level.
More Losses in BTC?If bitcoin price stays above the trend line support or $22,200, it could continue to move down. An immediate support on the downside is near the $22,000 zone.
The next major support is near the $21,900 zone or the 50% Fib retracement level of the key increase from the $20,395 swing low to $24,250 high. A downside break below the $21,900 level might send the price towards the $21,200 level. Any more losses might send the price to $20,500 in the near term.
Technical indicators:
Hourly MACD – The MACD is now losing pace in the bullish zone.
Hourly RSI (Relative Strength Index) – The RSI for BTC/USD is now below the 50 level.
Major Support Levels – $22,100, followed by $22,000.
Major Resistance Levels – $22,700, $22,850 and $23,200.
Why this matters
This bitcoin story adds another data point to the current market tape and is useful when read alongside nearby source coverage.
Original source
Read on NewsBTCRelated market context

XRP Price Prediction: Bears Eye $1 Support as Whale Activity Suddenly Collapses
While Ripple XRP is still holding above the psychologically important $1 level, analysts are closely monitoring whether buyers can...

Dogecoin Cools Near Support As Meme Traders Wait For A Cleaner Breakout Signal
Dogecoin is back in one of those awkward areas where both bulls and bears can make a case. Price has cooled into support rather th...

Kraken becomes first major US exchange to support USDC.e on Tempo network
Kraken's support for USDC.e on Tempo could accelerate stablecoin adoption in fintech, but liquidity and geographic limits may hind...

Ethereum Price Prediction: Robinhood Chain Leads Ethereum’s Biggest User Onboarding Wave
Price prediction debates are heating up as Ethereum trades at $1,790 and is slipping in trading volume. Still, Robinhood Chain kee...

Elon Musk Grok AI Predicts 3 Digits XRP Price This 2026
Amidst the current crypto market volatility, with XRP hovering around $1.06 after sharp corrections from previous highs, a bold ne...

Ethereum (ETH) Price Prediction: ETH Eyes $2,100 as ETF Inflows Return and Whale Demand Builds
Ethereum price is trading near $1,785 after a modest 24-hour recovery, but the market is now watching whether fresh inflows and wh...