Bitcoin Price Key Indicators Suggest Fresh Rally Toward $30K
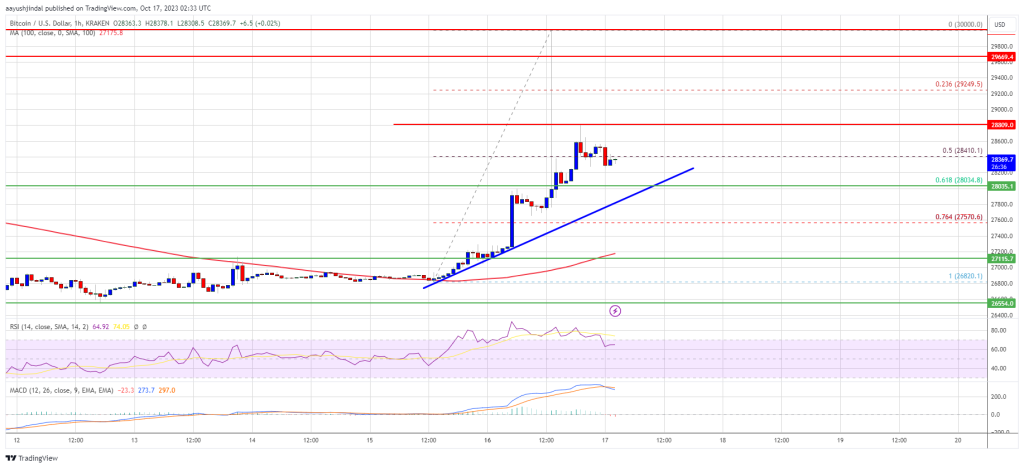
Bitcoin price spiked toward $30,000 after fake news about spot ETF hit the market. BTC is now consolidating above $28,200 and could rise toward $29,200. Bitcoin is holding gains above the $28,000 and $28,200 levels. The...
Archive context
Older archive item. Useful for background and entity history, but not a fresh market-moving signal.

Bitcoin price spiked toward $30,000 after fake news about spot ETF hit the market. BTC is now consolidating above $28,200 and could rise toward $29,200.
- Bitcoin is holding gains above the $28,000 and $28,200 levels.
- The price is trading above $28,200 and the 100 hourly Simple moving average.
- There is a key bullish trend line forming with support near $28,000 on the hourly chart of the BTC/USD pair (data feed from Kraken).
- The pair could start a fresh increase if there is a clear move above the $28,800 resistance.
Bitcoin price started a strong increase above the $27,500 resistance zone. BTC saw a wild increase after fake news about the spot ETF approval hit the market.
There was a nasty increase above the $28,500 resistance. The price even spiked toward $30,000 before trimming gains. There was a drop below the $29,200 and $28,800 support levels. The price even declined below the 50% Fib retracement level of the upward move from the $26,820 swing low to the $30,000 high.
Bitcoin price is now trading above $28,200 and the 100 hourly Simple moving average. There is also a key bullish trend line forming with support near $28,000 on the hourly chart of the BTC/USD pair. The trend line is near the 61.8% Fib retracement level of the upward move from the $26,820 swing low to the $30,000 high.
On the upside, immediate resistance is near the $28,600 level. The next key resistance could be near $28,800. A clear move above the $28,600 and $28,800 resistance levels could set the pace for a larger increase. The next key resistance could be $29,200.
Source: BTCUSD on TradingView.com
A close above the $29,200 resistance might start a steady increase toward the $29,500 level. Any more gains might send BTC toward the $30,000 level.
Another Decline In BTC?If Bitcoin fails to rise above the $28,800 resistance zone, it could slide further. Immediate support on the downside is near the $28,000 level and the trend line zone.
The next major support is near the $27,800 level. A downside break and close below the $27,800 support might send the price further lower. The next support sits at $27,200 and the 100 hourly Simple moving average.
Technical indicators:
Hourly MACD – The MACD is now gaining pace in the bullish zone.
Hourly RSI (Relative Strength Index) – The RSI for BTC/USD is now above the 50 level.
Major Support Levels – $28,000, followed by $27,800.
Major Resistance Levels – $28,600, $28,800, and $29,200.
Why this matters
This bitcoin story adds another data point to the current market tape and is useful when read alongside nearby source coverage.
Original source
Read on NewsBTCRelated market context

Bitcoin (BTC) Price Prediction: $65K Remains Key Resistance as 4-Year Cycle Model Signals Make-or-Break Moment
The Bitcoin price today remains around $62,600-$62,900, according to TradingView data, reflecting a market that has stabilized fol...

Ethereum Price Prediction: Tom Lee Predicts $5 Trillion Ethereum
Ethereum price prediction is back in focus after Fundstrat co-founder Tom Lee floated a $5 trillion network valuation. ETH trades...

Litecoin (LTC) Price Prediction: Mixed Technical Signals and Growing Hashrate Keep Traders Focused on $39 Support and $46 Breakout
Analysts are closely watching whether the Litecoin price can maintain support around $39 and break above the key $46 resistance le...

Why Bitcoin ATMs are becoming the last stop in America’s $11B crypto scam pipeline
Crypto scams start online with a fake bank alert, a cloned voice, a romance message, or a tech-support pop-up. Then, the last inst...

Bitcoin Price Prediction: Overlooked Indicator Gives the Bear Market 3 Months Left
Bitcoin is trading near $62,950 after gaining about 1.7% over the past 24 hours, but the latest price prediction is looking well b...

XRP Price Prediction: Judge in XRP Ruling Delivers Fresh Blow
Federal Judge Analisa Torres, the architect of XRP’s landmark 2023 securities ruling, has handed down another closely watched deci...