Bitcoin Price Key Indicators Suggest Strengthening Case For Upside Break
Bitcoin price is attempting an upside break above $16,800. BTC could gain bullish momentum if it clears the $16,800 and $17,000 levels. Bitcoin is still trading in a major range below the $16,800 and $17,000 resistance l...
Archive context
Older archive item. Useful for background and entity history, but not a fresh market-moving signal.

Bitcoin price is attempting an upside break above $16,800. BTC could gain bullish momentum if it clears the $16,800 and $17,000 levels.
- Bitcoin is still trading in a major range below the $16,800 and $17,000 resistance levels.
- The price is trading above $16,600 and the 100 hourly simple moving average.
- There is a key bullish trend line forming with support near $16,620 on the hourly chart of the BTC/USD pair (data feed from Kraken).
- The pair could gain bullish momentum if it settles above the $16,800 resistance.
Bitcoin price formed a base above the $16,350 support zone. BTC started a slow increase and was able to clear the $16,650 resistance zone. The price even spiked towards the $16,800 resistance zone.
However, there was no upside break above $16,800. A high was formed near $16,770 and the price started a downside correction. There was a drop below the $16,700 level, but the bulls are active above the $16,600 level.
Bitcoin price is now trading above $16,600 and the 100 hourly simple moving average. There is also a key bullish trend line forming with support near $16,620 on the hourly chart of the BTC/USD pair. On the upside, an immediate resistance is near the $16,685 level.
The 50% Fib retracement level of the recent decline from the $16,770 swing high to $16,599 low is also near the $16,685 level. The first major resistance is near the $16,700 zone.
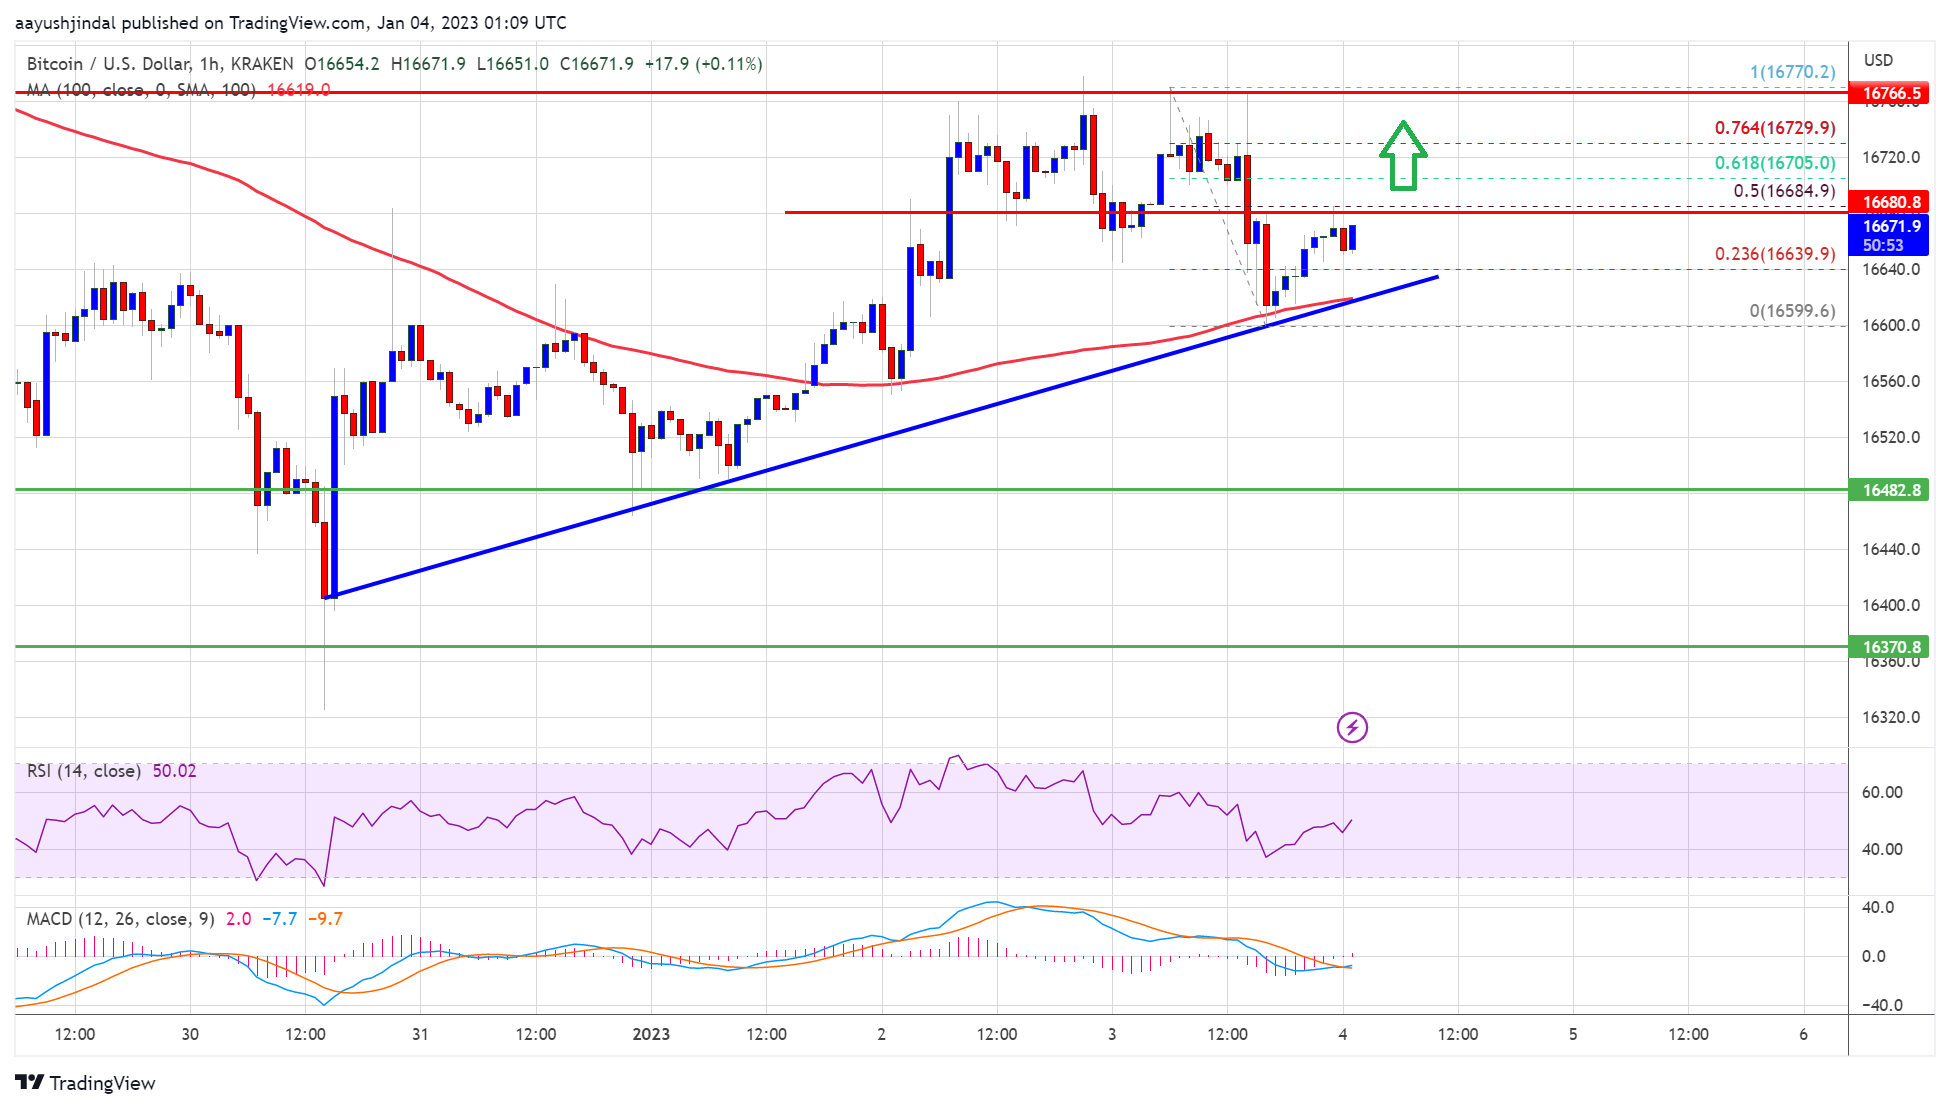
Source: BTCUSD on TradingView.com
The 61.8% Fib retracement level of the recent decline from the $16,770 swing high to $16,599 low is also near the $16,700 level. The next major resistance is near the $16,800 level. The main barrier is still near the $17,000 level. A clear close above the $17,000 resistance might start a fresh increase in the near term.
Fresh Drop in BTC?If bitcoin price fails to surpass the $16,800 resistance, it could start another decline. An immediate support on the downside is near the $16,620 level and the trend line.
The next major support is near the $16,500 level. A clear move below the $16,500 support might send the price towards the $16,350 level. Any more losses might send the price towards $16,000.
Technical indicators:
Hourly MACD – The MACD is now gaining pace in the bullish zone.
Hourly RSI (Relative Strength Index) – The RSI for BTC/USD is now above the 50 level.
Major Support Levels – $16,500, followed by $16,350.
Major Resistance Levels – $16,700, $16,800 and $17,000.
Why this matters
This bitcoin story adds another data point to the current market tape and is useful when read alongside nearby source coverage.
Original source
Read on NewsBTCRelated market context

Dogecoin Cools Near Support As Meme Traders Wait For A Cleaner Breakout Signal
Dogecoin is back in one of those awkward areas where both bulls and bears can make a case. Price has cooled into support rather th...

XRP Price Prediction: Bears Eye $1 Support as Whale Activity Suddenly Collapses
While Ripple XRP is still holding above the psychologically important $1 level, analysts are closely monitoring whether buyers can...

XRP Price Prediction: Key Metrics Point to a Crash
XRP prediction chatter is heating up even as the price slips, which is usually when markets like to play tricks. XRP trades at aro...

Bitcoin Price Prediction: Strategy Has a New BTC Approach
Bitcoin price is trading at $62,900, as we debate whether this pause is simply a reset or something more serious, with bearish pre...

Ethereum (ETH) Price Prediction: ETH Eyes $2,100 as ETF Inflows Return and Whale Demand Builds
Ethereum price is trading near $1,785 after a modest 24-hour recovery, but the market is now watching whether fresh inflows and wh...

Ethereum Price Prediction: Robinhood Chain Leads Ethereum’s Biggest User Onboarding Wave
Price prediction debates are heating up as Ethereum trades at $1,790 and is slipping in trading volume. Still, Robinhood Chain kee...