Bitcoin Price Key Trend is Forming And BTC Could Soon Surge to $18K
Bitcoin price gained pace for a fresh move above $17,000. BTC is rising and might climb higher towards the $18,000 resistance zone. Bitcoin started a fresh increase above $17,000 and $17,200 resistance levels. The price...
Archive context
Older archive item. Useful for background and entity history, but not a fresh market-moving signal.

Bitcoin price gained pace for a fresh move above $17,000. BTC is rising and might climb higher towards the $18,000 resistance zone.
- Bitcoin started a fresh increase above $17,000 and $17,200 resistance levels.
- The price is trading above $16,800 and the 100 hourly simple moving average.
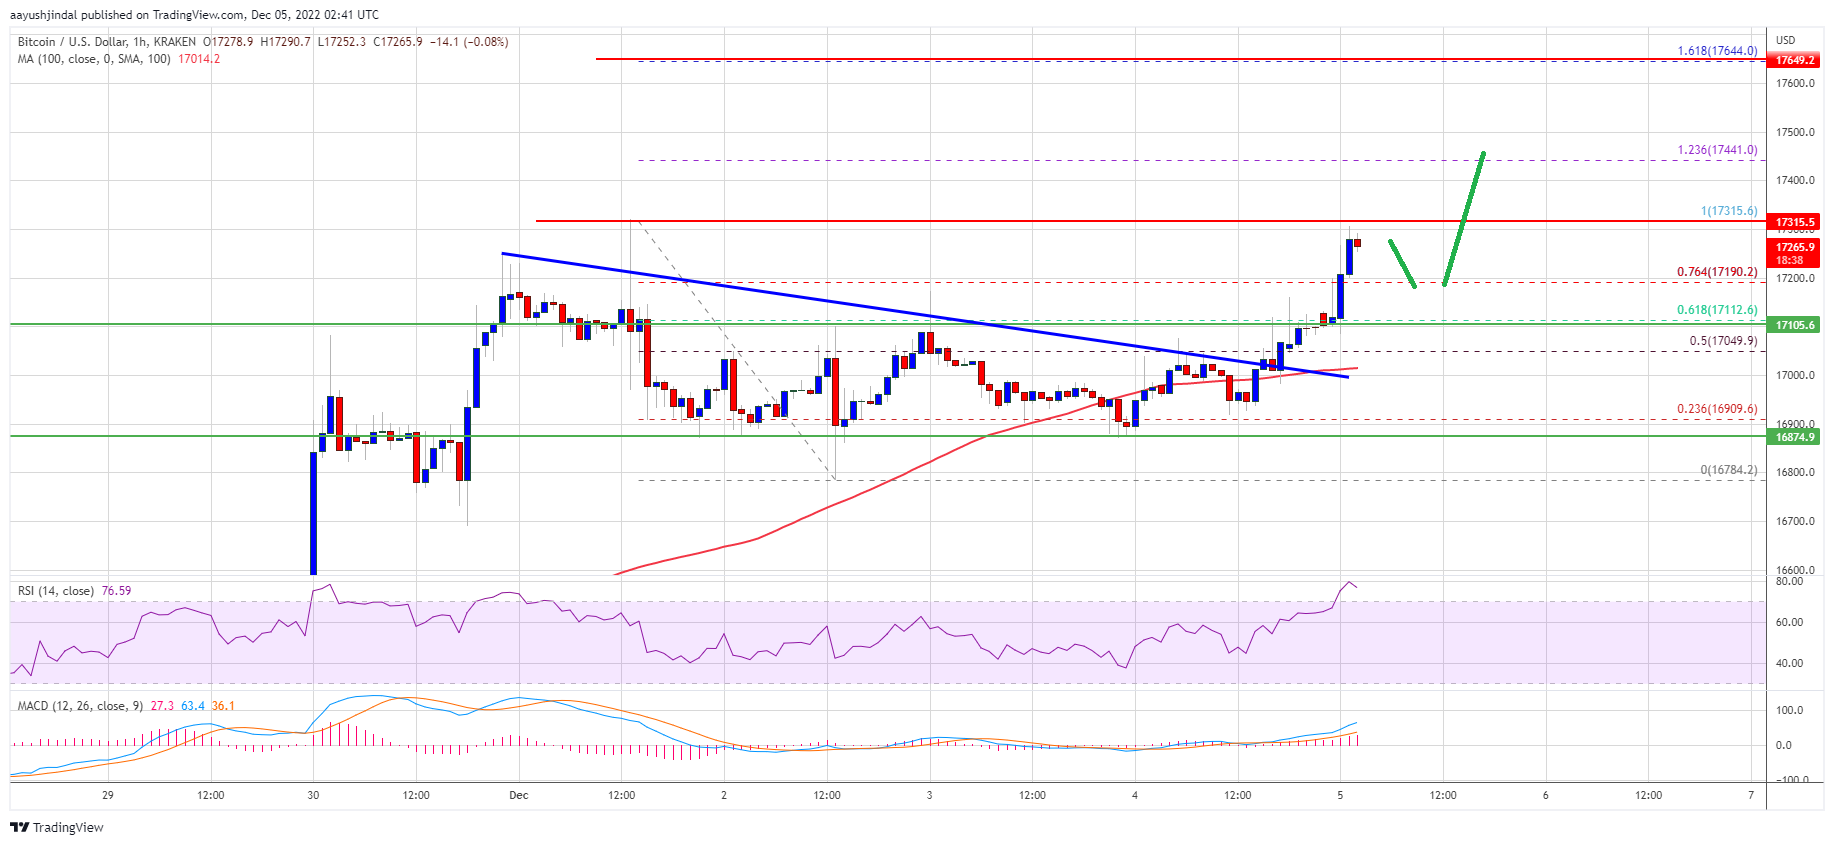
- There was a break above a major bearish trend line with resistance near $17,000 on the hourly chart of the BTC/USD pair (data feed from Kraken).
- The pair seems to be eyeing a move towards the $17,650 resistance or even $18,000.
Bitcoin price found support near the $16,800 zone after a downside correction. BTC remained well bid and started a fresh increase above the $17,000 resistance zone.
It even broke the $17,150 level and settled above the 100 hourly simple moving average. The price gained pace above the 76.4% Fib retracement level of the downward move from the $17,315 swing high to $16,784 swing low. Besides, there was a break above a major bearish trend line with resistance near $17,000 on the hourly chart of the BTC/USD pair.
Bitcoin price is now trading above $16,800 and the 100 hourly simple moving average. It is trading near the $17,250 level. On the upside, an immediate resistance is near the $17,350 level.
The first major resistance is near the $17,450 zone, above which the price may perhaps start another steady increase. In the stated case, the price could rise towards the $17,650 resistance. It is near the 1.618 Fib extension level of the downward move from the $17,315 swing high to $16,784 swing low.
Source: BTCUSD on TradingView.com
The next major resistance is near $18,000, above which the price could attempt a move towards the $18,500 zone in the near term.
Dips Limited in BTC?If bitcoin fails to start a fresh increase above the $17,350 resistance, there could be more downsides. An immediate support on the downside is near the $17,150 level.
The next major support is near the $17,000 zone and the 100 hourly simple moving average. A downside break below the $17,000 support might call for a move towards $16,750. Any more losses might call for a test of the key $16,500 support zone in the near term.
Technical indicators:
Hourly MACD – The MACD is now gaining pace in the bullish zone.
Hourly RSI (Relative Strength Index) – The RSI for BTC/USD is now in the overbought zone.
Major Support Levels – $17,150, followed by $17,000.
Major Resistance Levels – $17,350, $17,450 and $18,000.
Why this matters
This bitcoin story adds another data point to the current market tape and is useful when read alongside nearby source coverage.
Original source
Read on NewsBTCRelated market context

Ethereum (ETH) Price Prediction: ETH Eyes $2,100 as ETF Inflows Return and Whale Demand Builds
Ethereum price is trading near $1,785 after a modest 24-hour recovery, but the market is now watching whether fresh inflows and wh...

XRP’s $1 rebound faces holders trapped above $2
Glassnode reported that XRP holders who bought between 6 and 12 months ago have an average cost basis near $2.22, roughly 52% abov...

Bitcoin Price Jumps Above $64,000 as Cooler-Than-Expected Inflation Strengthens the Case for Rate Cuts
Bitcoin Magazine Bitcoin Price Jumps Above $64,000 as Cooler-Than-Expected Inflation Strengthens the Case for Rate Cuts Bitcoin pr...

Bitcoin pushes toward $65,000 on US inflation relief that may already be fading
Bitcoin approached $65,000 on July 14 as a sharper-than-expected slowdown in US inflation weakened the case for another near-term...

Ethereum Research Thread Puts Sybil Resistance Back In Focus For Decentralized Networks
Ethereum Research Thread Puts Sybil Resistance Back In Focus For Decentralized Networks is a useful reminder that crypto coverage...

XRP Price Prediction: Key Metrics Point to a Crash
XRP prediction chatter is heating up even as the price slips, which is usually when markets like to play tricks. XRP trades at aro...