Bitcoin Price Looks Ready For Another Leg Higher Over $17.5K
Bitcoin price remained well bid above the $16,920 support. BTC climbed higher and might soon aim an upside break above the $17,500 resistance zone. Bitcoin found a strong buying interest near the $16,920 and $16,900 leve...
Archive context
Older archive item. Useful for background and entity history, but not a fresh market-moving signal.

Bitcoin price remained well bid above the $16,920 support. BTC climbed higher and might soon aim an upside break above the $17,500 resistance zone.
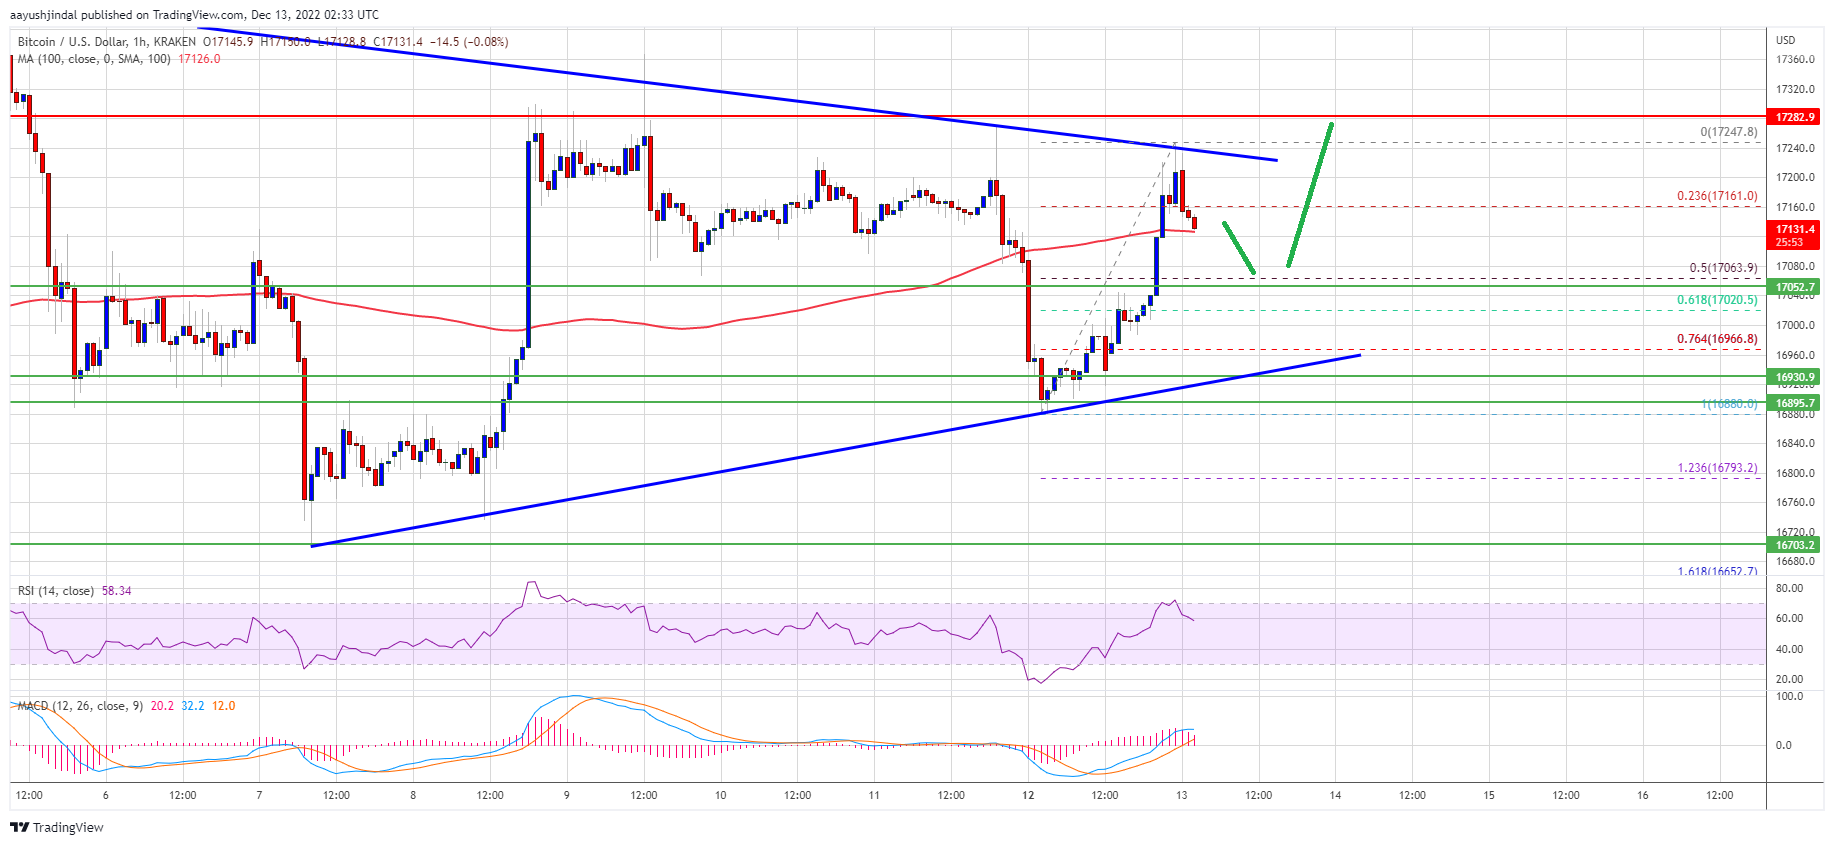
- Bitcoin found a strong buying interest near the $16,920 and $16,900 levels.
- The price is trading above $17,000 and the 100 hourly simple moving average.
- There is a major contracting triangle forming with resistance near $17,220 on the hourly chart of the BTC/USD pair (data feed from Kraken).
- The pair could gain bullish momentum if it clears the $17,250 and $17,450 resistance levels.
Bitcoin price corrected lower from the $17,292 swing high. BTC declined below the $17,000 level and the 100 hourly simple moving average.
However, the bulls were active near the $16,920 and $16,900 levels. A low was formed near $16,880 and the price started a fresh increase. There was a clear move above the $17,000 resistance zone and the 100 hourly simple moving average.
Bitcoin price is now consolidating gains near the $17,150 level. There was a minor decline below the 23.6% Fib retracement level of the recent increase from the $16,880 low to $17,247 high.
On the upside, an immediate resistance is near the $17,150 level. There is also a major contracting triangle forming with resistance near $17,220 on the hourly chart of the BTC/USD pair. The first major resistance is near the $17,300 zone, above which the price may perhaps revisit the $17,450 zone.
The next major resistance is near $17,500, above which the price start a steady increase and rise towards the $18,000 zone in the near term.
Dips Limited in BTC?If bitcoin fails to clear the $17,150 resistance, there could be a fresh decline. An immediate support on the downside is near the $17,120 level and the 100 hourly simple moving average.
The next major support is near the $17,000 zone. It is near the 50% Fib retracement level of the recent increase from the $16,880 low to $17,247 high. A downside break below the $17,000 support might call a drop towards $16,880. Any more losses might push the price towards the $16,500 zone in the near term.
Technical indicators:
Hourly MACD – The MACD is now losing pace in the bullish zone.
Hourly RSI (Relative Strength Index) – The RSI for BTC/USD is now above the 50 level.
Major Support Levels – $17,000, followed by $16,880.
Major Resistance Levels – $17,150, $17,300 and $17,450.
Why this matters
This bitcoin story adds another data point to the current market tape and is useful when read alongside nearby source coverage.
Original source
Read on NewsBTCRelated market context

Ethereum Price Prediction: Robinhood Chain Leads Ethereum’s Biggest User Onboarding Wave
Price prediction debates are heating up as Ethereum trades at $1,790 and is slipping in trading volume. Still, Robinhood Chain kee...

Ethereum Research Thread Puts Sybil Resistance Back In Focus For Decentralized Networks
Ethereum Research Thread Puts Sybil Resistance Back In Focus For Decentralized Networks is a useful reminder that crypto coverage...

XRP’s $1 rebound faces holders trapped above $2
Glassnode reported that XRP holders who bought between 6 and 12 months ago have an average cost basis near $2.22, roughly 52% abov...

Ethereum (ETH) Price Prediction: ETH Eyes $2,100 as ETF Inflows Return and Whale Demand Builds
Ethereum price is trading near $1,785 after a modest 24-hour recovery, but the market is now watching whether fresh inflows and wh...

XRP Price Prediction: Key Metrics Point to a Crash
XRP prediction chatter is heating up even as the price slips, which is usually when markets like to play tricks. XRP trades at aro...

Bitcoin Price Prediction: Strategy Has a New BTC Approach
Bitcoin price is trading at $62,900, as we debate whether this pause is simply a reset or something more serious, with bearish pre...