Bitcoin Price May Rally If Buyers Jump Above This Hurdle
Bitcoin price is back to struggling below the $20,000 price level. The coin over the last 24 hours has barely depicted any movement. In the last week, Bitcoin price fell by 1.7%. Overall, the king coin has been consolida...
Archive context
Older archive item. Useful for background and entity history, but not a fresh market-moving signal.

Bitcoin price is back to struggling below the $20,000 price level. The coin over the last 24 hours has barely depicted any movement.
In the last week, Bitcoin price fell by 1.7%. Overall, the king coin has been consolidating at this price mark over the last week now.
The technical outlook of Bitcoin has remained negative as the charts have not been favouring bulls.
Broader market weakness has been prevailing for almost a few months now. Sellers have become more active in the past week.
Bitcoin at the moment has been trading at a 71% low as compared to its all-time high which happened a little less than one year ago.
Buyers have to reclaim the immediate price ceiling for the asset to defeat the bulls. If BTC trades above the overhead resistance mark for long enough then the bulls could again attempt to defend the $20,000 price level.
Bitcoin Price Analysis: Four-Hour Chart Bitcoin was priced at $19,733 on the four-hour chart | Source: BTCUSD on TradingViewBTC was trading at $19,733 at the time of writing. Sellers had taken over the market as the volume of Bitcoin traded decreased in the last trading session.
The bulls have been facing constant resistance at the $20,000 price level.
Constant and continued rejections could push Bitcoin price to trade near the $18,000 support level. If buyers reclaim the $20,000 level, the other stiff resistance mark stood at $21,600.
Once the buyers topple that level, Bitcoin price could experience a rally. On the other hand, one push from the bears will force BTC to fall to $19,000.
Technical Analysis Bitcoin registered a fall in buying strength on the four-hour chart | Source: BTCUSD on TradingViewThe fall in BTC value has made buyers underconfident. The market strength has remained wobbly for a couple of months now.
Sellers have been dominating over the last few months with Bitcoin occasionally dropping into the oversold region.
The Relative Strength Index was more or less always beneath the half-line over the past week.
Bitcoin price was below the 20-SMA line too, signifying that the sellers were driving the price momentum in the market.
Bitcoin displayed a sell signal on the four-hour chart | Source: BTCUSD on TradingViewThe other technical indicators also depicted how the sellers continued to drive the price lower. The Moving Average Convergence Divergence helps to understand the market momentum and chance of a price reversal.
MACD was bearish as it experienced a bearish crossover and depicted red histograms above the half-line. This also indicates a sell signal for the coin explaining why buyers were low in number.
Chaikin Money Flow signals the volume of capital inflows and outflows. CMF was spotted very close to the half-line after it noted a downtick. The downtick is a sign of weakened capital inflows at press time.
Featured image from UnSplash, chart from TradingView.comWhy this matters
This bitcoin story adds another data point to the current market tape and is useful when read alongside nearby source coverage.
Original source
Read on NewsBTCRelated market context
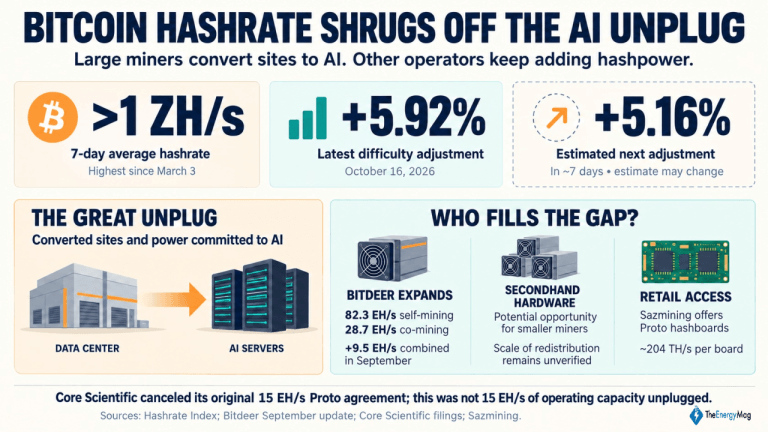
Miner Weekly: Bitcoin Hashrate Shrugs off the AI Unplug, Regaining 1 ZH/s Level
Big public miners are making room for artificial intelligence (AI). Bitcoin’s hashrate is climbing anyway. This article first appe...
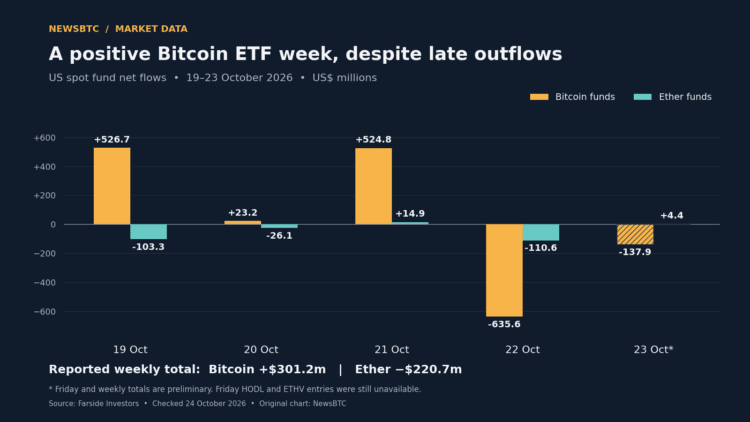
Bitcoin ETF Week Stays Positive After Nearly $774 Million In Late Outflows
TL;DR: Farside’s preliminary figures show US Bitcoin funds retaining a $301.2 million weekly inflow despite two days of withdrawal...

Bitcoin (BTC) Price Prediction: $74K Liquidity Gap Puts $80K Support to the Test
Meanwhile, data from Glassnode and Fasanara Digital show that traditional financial assets are capturing a growing share of deriva...
Bitcoin Hashrate Reclaims One Zettahash As Mining Competition Rebounds
TL;DR: BlocksBridge reported Bitcoin’s seven-day hashrate above one zettahash in the week to October 22. Mining competition has re...

US spot Bitcoin ETFs end two-week losing streak with $301M inflow
The recent inflow into US spot Bitcoin ETFs highlights investor caution and reliance on key funds, amid broader crypto market vola...

PHP Flaw Shakes Internet, Bitcoin Flashes Bull Signal, and More – Weekly Recap
This week’s stories covered shifting market signals, DeFi expansion, institutional staking, venture capital and cybersecurity. Uni...