Bitcoin Price Nearing Bottom? Key Indicators Suggest End Of Downturn–Bloomberg
As Bitcoin (BTC) seeks to solidify its position around $71,000, the cryptocurrency faces a challenge from the $74,000 resistance level that has so far prevented a decisive breakout. However, recent insights from Bloomber...

As Bitcoin (BTC) seeks to solidify its position around $71,000, the cryptocurrency faces a challenge from the $74,000 resistance level that has so far prevented a decisive breakout.
However, recent insights from Bloomberg indicate that a collection of indicators, historically associated with the conclusion of downward trends, suggest the current sell-off may be reaching its final phase.
Bitcoin Recovery In Sight?Brett Munster of Blockforce Capital said that one of these indicators has already entered a range that has frequently preceded past lows. Meanwhile, two others are indicating figures between $54,000 and $58,000, which is lower than the current price range of between $65,000 and $73,000 that was set during the month.
Although a definitive price floor is not guaranteed, Munster asserts that “the majority of the drawdown appears to be behind us,” suggesting that a market turnaround could potentially materialize by mid-year.
One of the critical indicators currently highlighting Bitcoin’s potential for recovery is the MVRV Z-Score. This measure signals when Bitcoin is trading above or below its on-chain cost basis.
When this score dips below 0.4, it typically indicates that the cryptocurrency is undervalued. Presently, the score is around 0.38, indicating that Bitcoin may indeed be undervalued, although other metrics have not yet confirmed this trend.
Potential Upside EmergesThe realized price of Bitcoin—the average price at which it has last moved on-chain—currently hovers near $54,000, while the 200-week moving average (MA), which has historically marked important support levels, is positioned around $58,000.
Moreover, the pattern of diminishing peak-to-trough drawdowns suggests a potential bottom could lie between $45,000 and $55,000. Collectively, these indicators define what Munster terms “a high-probability accumulation zone” ranging from approximately $45,000 to $60,000.
Although pinpointing an exact market bottom is inherently uncertain and bear markets can last longer than anticipated, Munster believes that Bitcoin presently offers a more favorable risk-reward profile with greater upside potential.
Featured image from OpenArt, chart from TradingView.com
Original source
Read on NewsBTCRelated market context

The 3-Part Impulse That Shows Where The XRP Price Is Headed Next
XRP bulls are trying to turn a brutal selloff into something bigger than a relief bounce. An interesting setup shows a possible th...

ETH futures traders lean into $1.6K range lows: Will Ether lead market recovery?
ETH traders increased their long positions as Ether price traded near 2026 lows. Will ETH’s rebound eclipse the BTC recovery?

Analyst Predicts Bitcoin Price Has Entered The Final Bear Market Phase
A crypto analyst has stated that the Bitcoin price remains firmly in a bear market, projecting more volatility and pain ahead for...
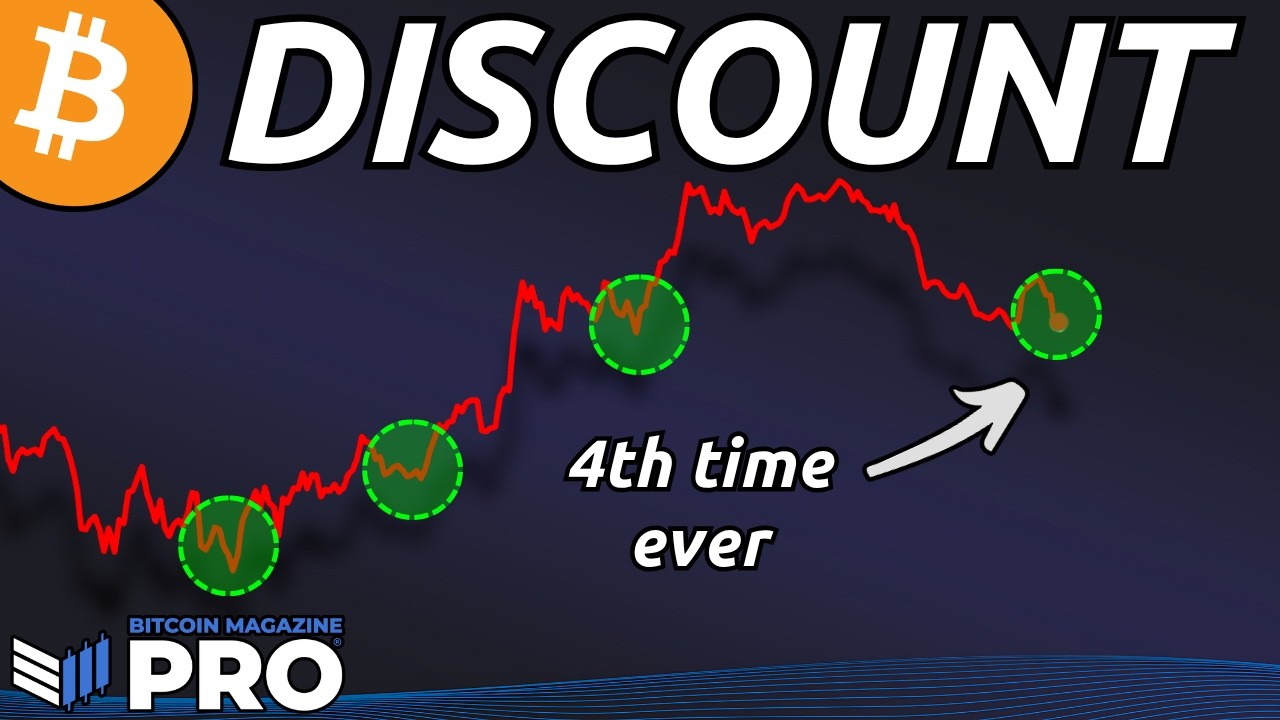
Strategy Stock MSTR Offers Bitcoin Exposure At 18% Discount
Bitcoin Magazine Strategy Stock MSTR Offers Bitcoin Exposure At 18% Discount I’ve been vocal about accumulating Bitcoin aggressive...

Elon Musk’s SpaceX IPO fever sparks $1 billion crypto bet before Nasdaq debut
Crypto traders have turned Elon Musk’s expected SpaceX listing into a round-the-clock proxy market, pushing more than $1 billion t...

Ethereum Nears 200 Million Non-Empty Wallets Despite Market Uncertainty
Despite persistent market uncertainty and bearish sentiment across parts of the cryptocurrency sector, Ethereum is approaching a s...