Bitcoin Price Prediction: This Scenario Will Trigger A Fresh Drop
Bitcoin price struggled to clear the $16,800 resistance. BTC is moving lower and there is a risk of more losses below the $16,000 support zone. Bitcoin attempted an upside break above the $16,800 resistance, but failed....
Archive context
Older archive item. Useful for background and entity history, but not a fresh market-moving signal.

Bitcoin price struggled to clear the $16,800 resistance. BTC is moving lower and there is a risk of more losses below the $16,000 support zone.
- Bitcoin attempted an upside break above the $16,800 resistance, but failed.
- The price is trading below $16,500 and the 100 hourly simple moving average.
- There is a major bearish trend line forming with resistance near $16,550 on the hourly chart of the BTC/USD pair (data feed from Kraken).
- The pair could continue to decline if it breaks the $16,000 support zone.
Bitcoin price attempted an upside break above the $16,800 resistance zone. BTC struggled to gain pace for a move above the $16,800 resistance and formed a double top pattern.
There was a slow and steady decline from the $16,791 high. There was a move below the $16,500 and $16,400 levels. The bears were able to push the price below the 23.6% Fib retracement level of the upward move from the $15,470 swing low to $16,790 high.
Bitcoin price is now trading below $16,500 and the 100 hourly simple moving average. There is also a major bearish trend line forming with resistance near $16,550 on the hourly chart of the BTC/USD pair.
The price is now consolidating near the 50% Fib retracement level of the upward move from the $15,470 swing low to $16,790 high. On the upside, an immediate resistance is near the $16,300 level.
Source: BTCUSD on TradingView.com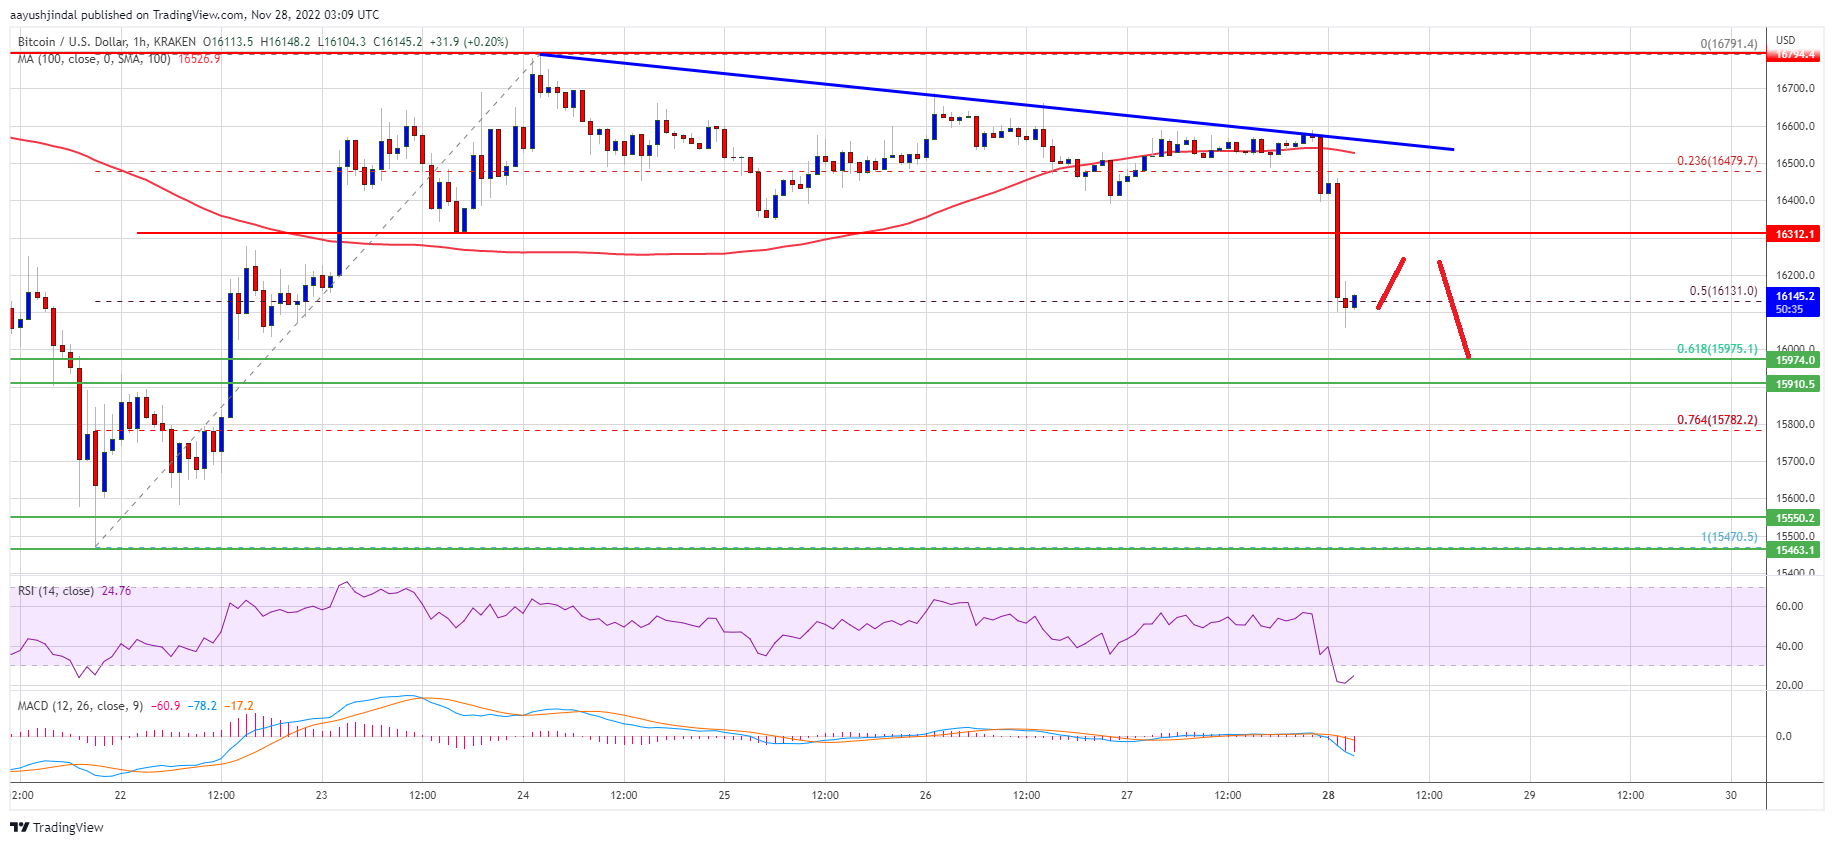
The first major resistance is near the $16,500 zone, the 100 hourly simple moving average, and the highlighted bearish trend line. A successful move above the $16,500 resistance might send the price further higher. The next major resistance is near $16,800, above which the price could gain pace for a move towards the $17,500 zone.
More Losses in BTC?If bitcoin fails to climb above the $16,500 resistance, it could continue to move down. An immediate support on the downside is near the $16,100 level.
The next major support is near the $16,000 zone, below which the price might gain bearish momentum. In the stated case, the price might drop towards the $15,500 support zone.
Technical indicators:
Hourly MACD – The MACD is now gaining pace in the bearish zone.
Hourly RSI (Relative Strength Index) – The RSI for BTC/USD is now below the 50 level.
Major Support Levels – $16,100, followed by $16,000.
Major Resistance Levels – $16,500, $16,800 and $17,000.
Why this matters
This bitcoin story adds another data point to the current market tape and is useful when read alongside nearby source coverage.
Original source
Read on NewsBTCRelated market context

Ethereum Price Prediction: Robinhood Chain Leads Ethereum’s Biggest User Onboarding Wave
Price prediction debates are heating up as Ethereum trades at $1,790 and is slipping in trading volume. Still, Robinhood Chain kee...

Ethereum Research Thread Puts Sybil Resistance Back In Focus For Decentralized Networks
Ethereum Research Thread Puts Sybil Resistance Back In Focus For Decentralized Networks is a useful reminder that crypto coverage...

XRP’s $1 rebound faces holders trapped above $2
Glassnode reported that XRP holders who bought between 6 and 12 months ago have an average cost basis near $2.22, roughly 52% abov...

XRP Price Prediction: Key Metrics Point to a Crash
XRP prediction chatter is heating up even as the price slips, which is usually when markets like to play tricks. XRP trades at aro...

Bitcoin Price Prediction: Strategy Has a New BTC Approach
Bitcoin price is trading at $62,900, as we debate whether this pause is simply a reset or something more serious, with bearish pre...

SharpLink generates 499 Ethereum from staking rewards this week, total holdings near 888K ETH
SharpLink's strategic ETH accumulation and staking rewards enhance its market position, offering investors indirect Ethereum expos...