Bitcoin Price Prints Bearish Pattern And Could Dive To New Weekly Low
Bitcoin price is struggling to rise above the $29,300 resistance level. BTC could start another decline and trade below the $28,880 support zone. Bitcoin is struggling to rise above the $29,300 and $29,600 levels. The pr...
Archive context
Older archive item. Useful for background and entity history, but not a fresh market-moving signal.

Bitcoin price is struggling to rise above the $29,300 resistance level. BTC could start another decline and trade below the $28,880 support zone.
- Bitcoin is struggling to rise above the $29,300 and $29,600 levels.
- The price is trading below $29,300 and the 100 hourly Simple moving average.
- There was a break below a major bullish trend line with support near $29,300 on the hourly chart of the BTC/USD pair (data feed from Kraken).
- The pair could continue to move down unless there is a close above the $29,600 resistance.
Bitcoin price attempted a short-term recovery wave above the $29,200 resistance zone. BTC was able to climb above the $29,300 resistance zone but the upsides were limited.
The price struggled to clear a major hurdle near the $29,600 level as mentioned in yesterday’s post. It seems like the bears defended the 50% Fib retracement level of the upward wave from the $30,334 swing high to the $28,880 low.
Bitcoin price started a fresh decline below the $29,400 level. There was a break below a major bullish trend line with support near $29,300 on the hourly chart of the BTC/USD pair.
The price is now trading below $29,300 and the 100 hourly Simple moving average. Immediate resistance is near the $29,300 level and the 100 hourly Simple moving average. The first major resistance is still near the $29,600 level.
Source: BTCUSD on TradingView.com
The next major resistance is near the $29,800 level or the 61.8% Fib retracement level of the upward wave from the $30,334 swing high to the $28,880 low, above which the price might rise toward the $30,000 resistance zone. The next major resistance is near the $30,400 level.
More Losses in BTC?If Bitcoin fails to clear the $29,300 resistance, it could continue to move down. Immediate support on the downside is near the $29,000 level.
The next major support is near the $28,880 level, below which the price could accelerate lower. The next support is near the $28,200 level. Any more losses might call for a move toward the $27,700 level in the near term.
Technical indicators:
Hourly MACD – The MACD is now gaining pace in the bearish zone.
Hourly RSI (Relative Strength Index) – The RSI for BTC/USD is now below the 50 level.
Major Support Levels – $29,000, followed by $28,880.
Major Resistance Levels – $29,300, $29,600, and $30,000.
Why this matters
This bitcoin story adds another data point to the current market tape and is useful when read alongside nearby source coverage.
Original source
Read on NewsBTCRelated market context

Avalanche (AVAX) Price Prediction: AVAX Slips Near $6.71 as ETF Removal, Bearish Patterns, and $6.50 Support Put Bulls Under Pressure
AVAX price is trading near $6.71 after falling around 1% over the past 24 hours, based on Brave New Coin data. The move keeps AVAX...

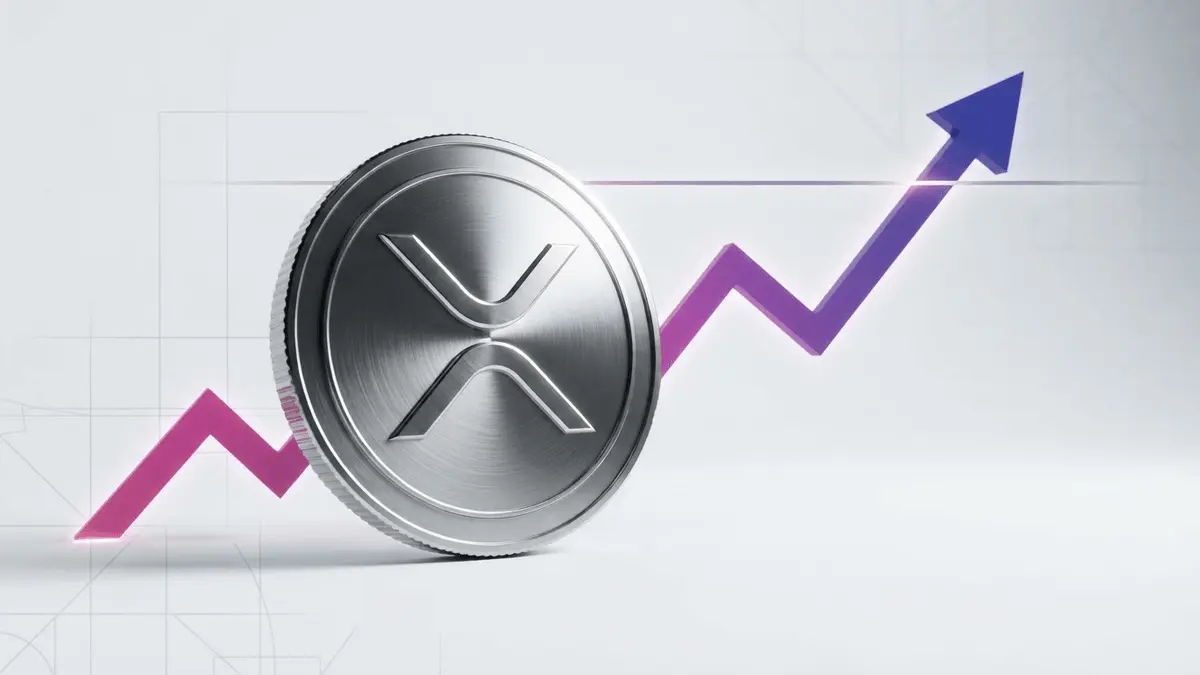
XRP Price Prediction: Analyst Maps Rally to $2.55 as Macro Accumulation Zone Holds
While current market indicators point to limited momentum, several chart analysts argue that the XRP price remains within a histor...

Ethereum (ETH) Price Prediction: ETH Slips Towards $1,746 as Bulls Eye $1,800 Breakout and OBV Confirmation
Ethereum is currently trading around $1,746 following a mild pullback over the past 24 hours. The asset has slipped roughly 1.56%...

Bitcoin’s $10 billion credit market keeps growing after its first major selloff
Bitcoin’s more than $10 billion corporate credit market is still attracting new entrants after a June selloff triggered margin cal...

Bitcoin’s $64K rebound has 3 days before its next big challenge threatens to derail momentum
Bitcoin traded near $64,100 on Saturday as the clock ticked toward a key test for its rebound. June's US consumer price index is d...
XRP Price Prediction: Can XRP Crack $1.20 Before Clarity Act?
XRP price prediction remains centered on one question: can buyers finally push through the $1.15 to $1.20 resistance range? For no...