Bitcoin Price Prints Bearish Technical Pattern, Why It Could Continue Lower
Bitcoin price declined heavily and traded below $17,000. BTC is consolidating losses and remains at a risk of more losses below the $16,500 support. Bitcoin started a fresh decline below the $17,200 and $17,000 support l...
Archive context
Older archive item. Useful for background and entity history, but not a fresh market-moving signal.

Bitcoin price declined heavily and traded below $17,000. BTC is consolidating losses and remains at a risk of more losses below the $16,500 support.
- Bitcoin started a fresh decline below the $17,200 and $17,000 support levels.
- The price is trading below $17,000 and the 100 hourly simple moving average.
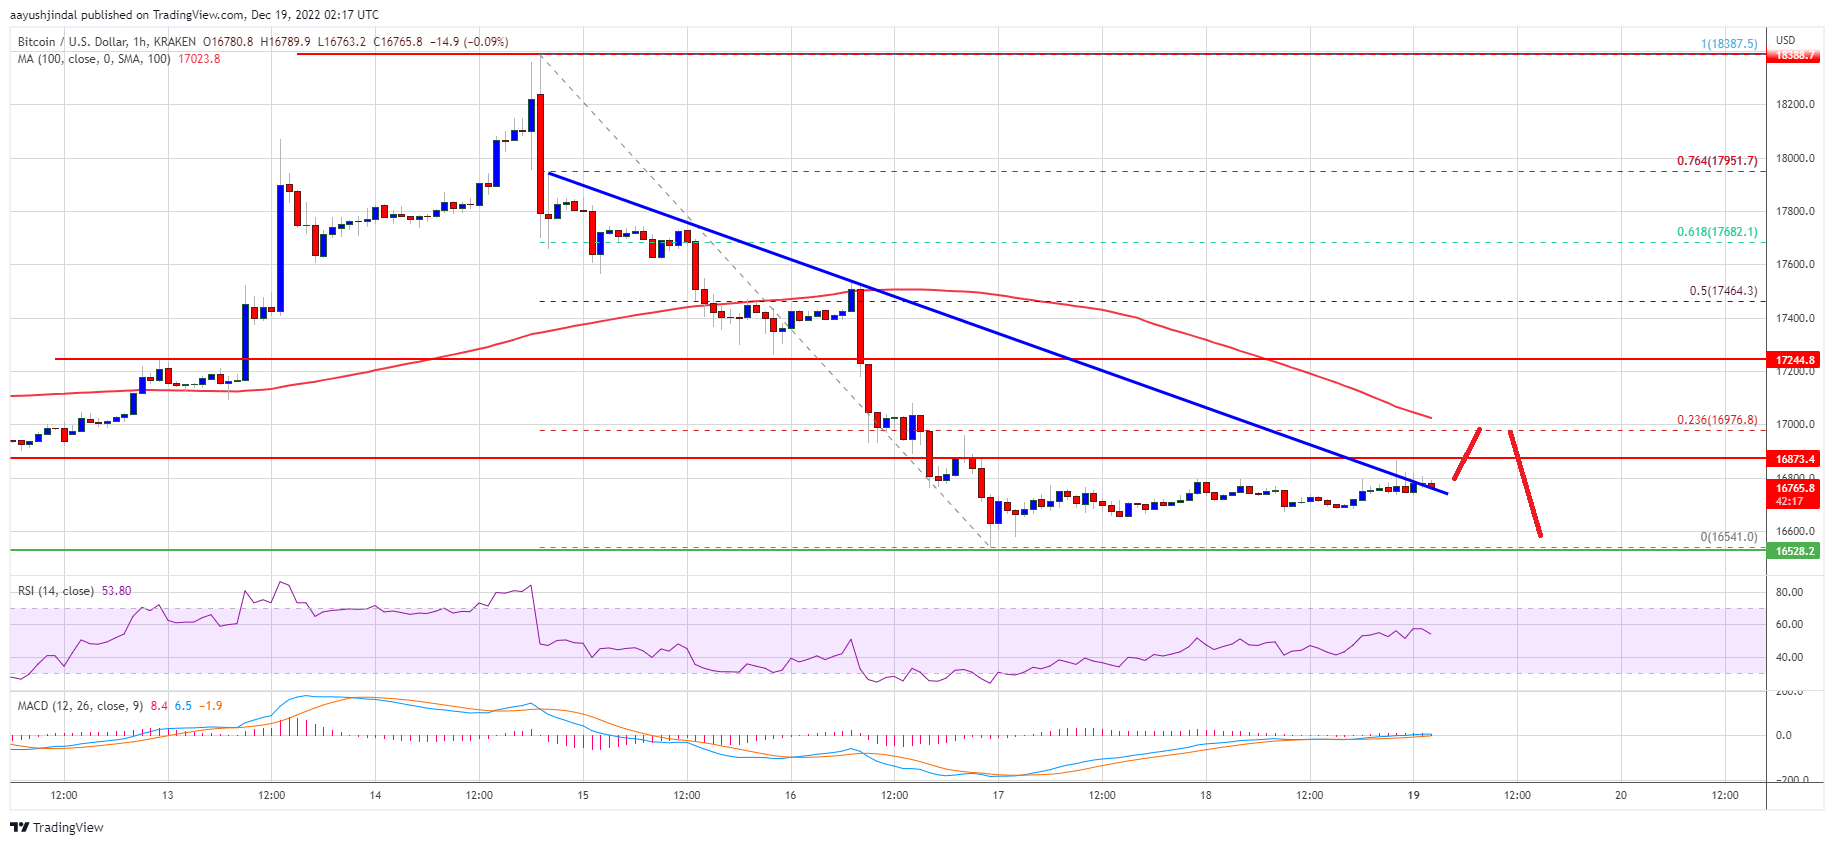
- There is a key bearish trend line forming with resistance near $16,800 on the hourly chart of the BTC/USD pair (data feed from Kraken).
- The pair could continue to move lower unless it clears the 100 hourly SMA.
Bitcoin price restarted a fresh decline from the $18,400 zone resistance zone. BTC gained pace below the $17,500 and $17,200 support levels. The bears even pushed it below the $17,000 level and the 100 hourly simple moving average.
It tested the $16,500 support zone. A low is formed near $16,541 and the price is now consolidating losses. It climbed a few points higher and traded above the $16,700 level.
Bitcoin price is now trading below $17,000 and the 100 hourly simple moving average. On the upside, an immediate resistance is near the $16,800 zone. There is also a key bearish trend line forming with resistance near $16,800 on the hourly chart of the BTC/USD pair.
The first major resistance is near the $17,000 zone and the 100 hourly simple moving average. It is near the 23.6% Fib retracement level of the downward move from the $18,387 swing high to $16,541 swing low.
Source: BTCUSD on TradingView.com
A clear move above the $17,000 resistance might call for a move towards the $17,500 resistance. It is close to the 50% Fib retracement level of the downward move from the $18,387 swing high to $16,541 swing low. The next major resistance is near $17,800, above which the price might gain pace and rise towards the $18,000 level.
More Losses in BTC?If bitcoin fails to clear the $17,000 resistance, there could be more downsides. An immediate support on the downside is near the $16,600 level.
The next major support is near the $16,500 zone. A downside break below the $16,500 support might call more losses. In the stated case, the price could decline towards the $16,000 support in the near term. Any more losses might send the price towards $15,500.
Technical indicators:
Hourly MACD – The MACD is now losing pace in the bearish zone.
Hourly RSI (Relative Strength Index) – The RSI for BTC/USD is now above the 50 level.
Major Support Levels – $16,600, followed by $16,500.
Major Resistance Levels – $16,800, $17,000 and $17,500.
Why this matters
This bitcoin story adds another data point to the current market tape and is useful when read alongside nearby source coverage.
Original source
Read on NewsBTCRelated market context

XRP Price Prediction: Key Metrics Point to a Crash
XRP prediction chatter is heating up even as the price slips, which is usually when markets like to play tricks. XRP trades at aro...

Bitcoin Price Prediction: Strategy Has a New BTC Approach
Bitcoin price is trading at $62,900, as we debate whether this pause is simply a reset or something more serious, with bearish pre...

Ethereum Price Prediction: Robinhood Chain Leads Ethereum’s Biggest User Onboarding Wave
Price prediction debates are heating up as Ethereum trades at $1,790 and is slipping in trading volume. Still, Robinhood Chain kee...

XRP’s $1 rebound faces holders trapped above $2
Glassnode reported that XRP holders who bought between 6 and 12 months ago have an average cost basis near $2.22, roughly 52% abov...

Ethereum (ETH) Price Prediction: ETH Eyes $2,100 as ETF Inflows Return and Whale Demand Builds
Ethereum price is trading near $1,785 after a modest 24-hour recovery, but the market is now watching whether fresh inflows and wh...

US Government Moves Nearly 4,000 BTC to Coinbase Prime, Onchain Data Shows
The U.S. government transferred nearly 4,000 bitcoin to Coinbase Prime on July 13, raising questions about whether the roughly $25...