Bitcoin Price Reaches Rejection Zone: Can It Overcome the Resistance?
Bitcoin price recovered above the $62,000 resistance zone. BTC must clear the $62,500 resistance zone to continue higher in the near term. Bitcoin started a recovery wave above the $61,500 and $62,000 levels. The price i...
Archive context
Older archive item. Useful for background and entity history, but not a fresh market-moving signal.

Bitcoin price recovered above the $62,000 resistance zone. BTC must clear the $62,500 resistance zone to continue higher in the near term.
- Bitcoin started a recovery wave above the $61,500 and $62,000 levels.
- The price is trading below $63,000 and the 100 hourly Simple moving average.
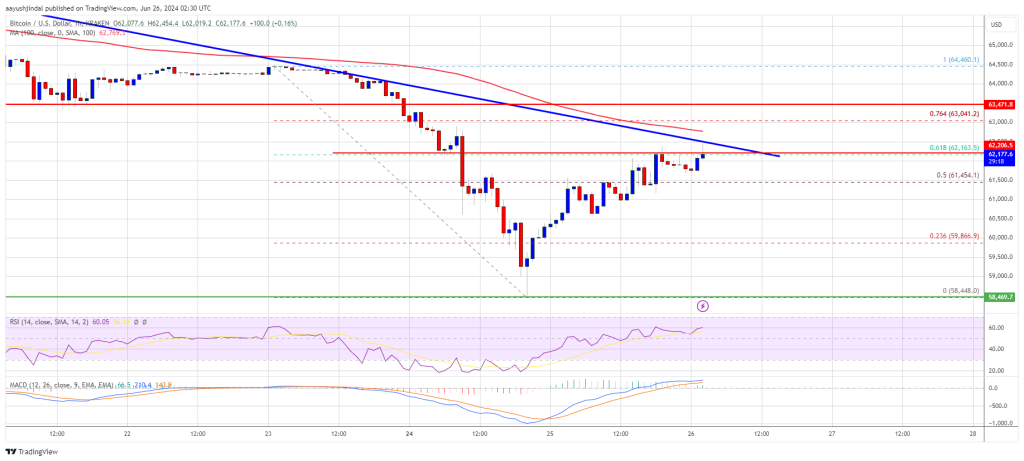
- There is a key bearish trend line forming with resistance at $62,500 on the hourly chart of the BTC/USD pair (data feed from Kraken).
- The pair might struggle to rise above the $62,500 and $63,000 resistance levels.
Bitcoin price extended losses below the $60,000 support zone. BTC even tested the $58,500 support zone, where the bulls emerged. A low was formed at $58,448 and the price is now correcting losses. There was a decent increase above the $60,000 level.
The price climbed above the 50% Fib retracement level of the downward wave from the $64,460 swing high to the $58,448 low. It even moved above the $62,000 pivot level. However, Bitcoin price is still trading below $63,000 and the 100 hourly Simple moving average.
The price seems to be facing a rejection zone near the $62,500 resistance, as discussed yesterday. There is also a key bearish trend line forming with resistance at $62,500 on the hourly chart of the BTC/USD pair. It is close to the 61.8% Fib retracement level of the downward wave from the $64,460 swing high to the $58,448 low.
The next key resistance could be $63,000. A clear move above the $63,000 resistance might start a steady increase and send the price higher. In the stated case, the price could rise and test the $63,500 resistance. Any more gains might send BTC toward the $65,000 resistance in the near term.
Another Decline In BTC?If Bitcoin fails to climb above the $62,500 resistance zone, it could start another decline. Immediate support on the downside is near the $60,500 level.
The first major support is $60,000. The next support is now forming near $59,500. Any more losses might send the price toward the $58,500 support zone in the near term.
Technical indicators:
Hourly MACD – The MACD is now gaining pace in the bullish zone.
Hourly RSI (Relative Strength Index) – The RSI for BTC/USD is now above the 50 level.
Major Support Levels – $60,500, followed by $60,000.
Major Resistance Levels – $62,500, and $63,000.
Why this matters
This bitcoin story adds another data point to the current market tape and is useful when read alongside nearby source coverage.
Original source
Read on NewsBTCRelated market context

Bitcoin (BTC) Price Prediction: BTC Holds $63K Support—Can Rising Active Addresses Offset Bearish Technical Signals?
Although the BTC price has remained near a key support zone, recent chart signals and Strategy’s sale of a portion of its Bitcoin...

Bitcoin price rebounds to $63K as leverage returns creating short term volatility risk
Bitcoin's rebound has cleared the first test: price recovered. The harder one starts now: proving buyers remain after the squeeze....

Bitcoin Price Prediction: Peter Brandt Might Dump BTC for Gold
Bitcoin is facing a test, and its price prediction is not helping. So far in 2026, BTC has fallen about 28%, while gold is down ju...

XRP Price Prediction: Volume and ETF Inflow Send Ripple Token Higher
XRP price pushed above the $1.14 resistance area after buyers stepped in with heavy volume and bullish prediction. The token climb...

IPO volume hits levels last seen in 1929 and 2000, and crypto markets are building the on-ramp
The surge in IPOs and crypto's role in facilitating access could signal heightened market volatility and regulatory challenges ahe...

Bitcoin miner bottom signal now depends on who survives weak mining profits
A Bitcoin miner-stress signal circulating on X has fallen into a zone analysts associate with severe miner pressure, putting a fam...