Bitcoin Price Recovery Could Face Many Hurdles Near $60K, Here’s Why
Bitcoin price found support near the $56,350 zone. BTC is recovering higher, but the bears might be active near the $60,000 resistance zone. Bitcoin is attempting a recovery wave from the $56,350 support zone. The price...
Archive context
Older archive item. Useful for background and entity history, but not a fresh market-moving signal.

Bitcoin price found support near the $56,350 zone. BTC is recovering higher, but the bears might be active near the $60,000 resistance zone.
- Bitcoin is attempting a recovery wave from the $56,350 support zone.
- The price is trading below $60,000 and the 100 hourly Simple moving average.
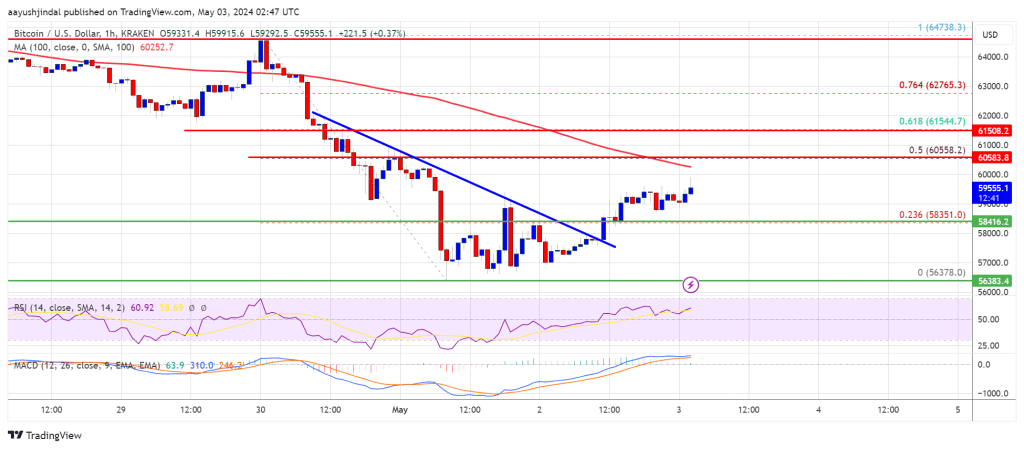
- There was a break above a key bearish trend line with resistance at $57,800 on the hourly chart of the BTC/USD pair (data feed from Kraken).
- The pair could struggle to clear the $60,000 and $60,500 resistance levels.
Bitcoin price extended losses below the $60,000 level to enter a short-term bearish zone. BTC even traded below the $58,000 level before the bulls appeared near the $56,350 level.
A low was formed at $56,378 and the price started a decent recovery wave. The price climbed above the $58,000 resistance zone. There was a break above a key bearish trend line with resistance at $57,800 on the hourly chart of the BTC/USD pair.
The price climbed above the 23.6% Fib retracement level of the downward wave from the $64,738 swing high to the $56,378 low. Bitcoin is still trading below $60,000 and the 100 hourly Simple moving average.
Immediate resistance is near the $60,000 level. The first major resistance could be $60,500. It is close to the 50% Fib retracement level of the downward wave from the $64,738 swing high to the $56,378 low. The next key resistance could be $61,500.
Source: BTCUSD on TradingView.com
A clear move above the $61,500 resistance might send the price higher. The next resistance now sits at $63,400. If there is a clear move above the $63,400 resistance zone, the price could continue to move up. In the stated case, the price could rise toward $65,000.
Rejection In BTC?If Bitcoin fails to rise above the $60,500 resistance zone, it could start another decline. Immediate support on the downside is near the $58,500 level.
The first major support is $57,800. If there is a close below $57,800, the price could start to drop toward $56,350. Any more losses might send the price toward the $55,000 support zone in the near term.
Technical indicators:
Hourly MACD – The MACD is now losing pace in the bearish zone.
Hourly RSI (Relative Strength Index) – The RSI for BTC/USD is now above the 50 level.
Major Support Levels – $57,000, followed by $56,500.
Major Resistance Levels – $60,000, $60,500, and $61,500.
Why this matters
This bitcoin story adds another data point to the current market tape and is useful when read alongside nearby source coverage.
Original source
Read on NewsBTCRelated market context

Bitcoin’s rebound approaches the $85,000 zone where past buyers may sell
Bitcoin and Ethereum extended their weekend recovery, although on-chain indicators and derivatives positioning suggest the rebound...

SUI Crypto Up +2% Following $30M DATA Network Investment
SUI crypto trades at $1.12, up +2.2% over 24 hours, as traders weigh a sharp recent rebound against overhead resistance. The Sui F...

Bitcoin slips below $83,000, wiping out nearly $42 million in longs before the US open
Leverage-induced volatility highlights the risks in Bitcoin trading, emphasizing the need for cautious positioning and monitoring...

Meta AI Predicts This Huge Catalyst Could Lead to $40 XRP
Mark Zuckerberg’s Meta AI predicts an insanely wild bullish price target for XRP by January 1, 2027. The AI bot believes $25–$40 i...
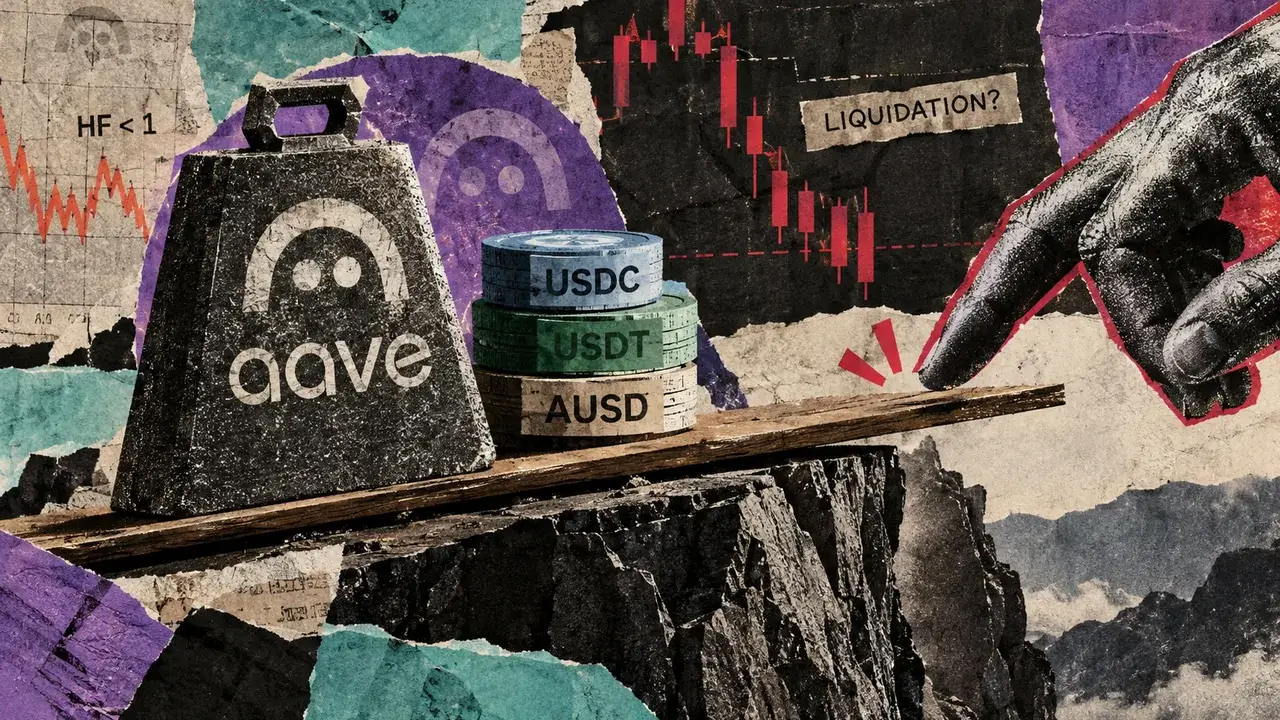
Some Aave loans sit near liquidation with collateral that can take hours to cash out
Some Aave loans backed by yield-bearing collateral had narrow liquidation buffers in LlamaRisk’s Oct. 9 snapshots. Every top PT-AU...

Meta AI Predicts 7-Figure BTC in 2026, But How?
Mark Zuckerberg’s Meta AI predicts that if a full-blown crypto bull market returns in Q4 and a landmark catalyst turbocharges it,...