Bitcoin Price Recovery Remains Capped, Why 100 SMA Is The Key
Bitcoin price started an upside correction from $15,500. BTC is now facing a strong resistance near the $16,300 zone and the 100 hourly SMA. Bitcoin found support near $15,500 and started an upside correction. The price...
Archive context
Older archive item. Useful for background and entity history, but not a fresh market-moving signal.

Bitcoin price started an upside correction from $15,500. BTC is now facing a strong resistance near the $16,300 zone and the 100 hourly SMA.
- Bitcoin found support near $15,500 and started an upside correction.
- The price is trading below $16,300 and the 100 hourly simple moving average.
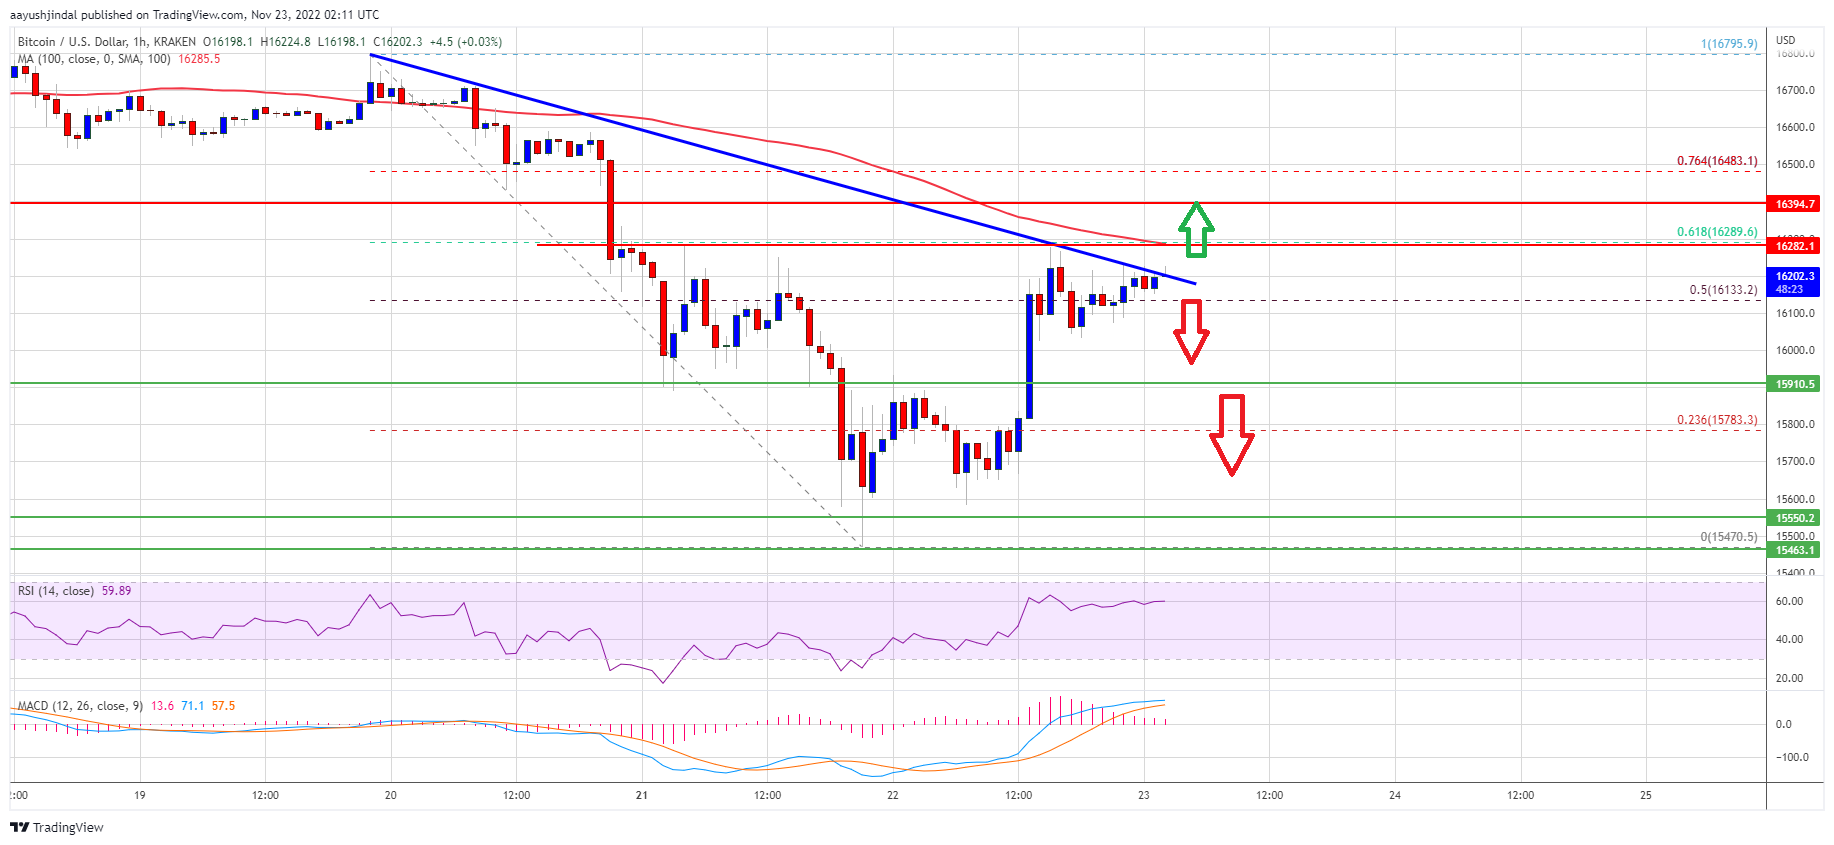
- There is a crucial bearish trend line forming with resistance near $16,200 on the hourly chart of the BTC/USD pair (data feed from Kraken).
- The pair could continue to rise if it clears the $16,300 level and the 100 hourly SMA.
Bitcoin price extended its decline below the $16,000 support level. BTC even spiked below the $15,800 support level, but the bulls were active near the $15,500 level.
A low was formed near $15,470 and the price started an upside correction. There was a move above the $15,800 and $16,000 resistance levels. The bulls were able to push the price above the 50% Fib retracement level of the key decline from the $16,795 swing high to $15,470 low.
Bitcoin price is now trading below $16,300 and the 100 hourly simple moving average. There is also a crucial bearish trend line forming with resistance near $16,200 on the hourly chart of the BTC/USD pair.
On the upside, an immediate resistance is near the $16,200 level. The first major resistance is near the $16,300 zone and the 100 hourly simple moving average. It is close to the 61.8% Fib retracement level of the key decline from the $16,795 swing high to $15,470 low.
Source: BTCUSD on TradingView.com
The price must clear the trend line resistance and then $16,300 to start a decent recovery wave. The next major resistance is near $16,500, above which the price could gain pace for a move towards the $17,000 zone.
Fresh Decline in BTC?If bitcoin fails to recover above the $16,300 resistance zone, it could start another decline. An immediate support on the downside is near the $15,900 level.
The next major support is near the $15,550 zone, below which the price might even struggle to stay above $15,500. A clear move below the $15,500 support might send the price towards the $14,000 support zone.
Technical indicators:
Hourly MACD – The MACD is now losing pace in the bullish zone.
Hourly RSI (Relative Strength Index) – The RSI for BTC/USD is now above the 50 level.
Major Support Levels – $15,900, followed by $15,500.
Major Resistance Levels – $16,200, $16,300 and $17,000.
Why this matters
This bitcoin story adds another data point to the current market tape and is useful when read alongside nearby source coverage.
Original source
Read on NewsBTCRelated market context

XRP’s $1 rebound faces holders trapped above $2
Glassnode reported that XRP holders who bought between 6 and 12 months ago have an average cost basis near $2.22, roughly 52% abov...

Ethereum (ETH) Price Prediction: ETH Eyes $2,100 as ETF Inflows Return and Whale Demand Builds
Ethereum price is trading near $1,785 after a modest 24-hour recovery, but the market is now watching whether fresh inflows and wh...

Bitcoin pushes toward $65,000 on US inflation relief that may already be fading
Bitcoin approached $65,000 on July 14 as a sharper-than-expected slowdown in US inflation weakened the case for another near-term...

XRP Price Prediction: Key Metrics Point to a Crash
XRP prediction chatter is heating up even as the price slips, which is usually when markets like to play tricks. XRP trades at aro...

Bitcoin Price Jumps Above $64,000 as Cooler-Than-Expected Inflation Strengthens the Case for Rate Cuts
Bitcoin Magazine Bitcoin Price Jumps Above $64,000 as Cooler-Than-Expected Inflation Strengthens the Case for Rate Cuts Bitcoin pr...

Bitcoin Price Prediction: Strategy Has a New BTC Approach
Bitcoin price is trading at $62,900, as we debate whether this pause is simply a reset or something more serious, with bearish pre...