Bitcoin Price Recovery Won’t Be Easy, Why Bears Target Additional Weakness
Bitcoin price is struggling below the $19,200 support against the US Dollar. BTC remains at a risk of more losses below the $18,500 support in the near term. Bitcoin is showing bearish signs below the $19,200 and $19,500...
Archive context
Older archive item. Useful for background and entity history, but not a fresh market-moving signal.

Bitcoin price is struggling below the $19,200 support against the US Dollar. BTC remains at a risk of more losses below the $18,500 support in the near term.
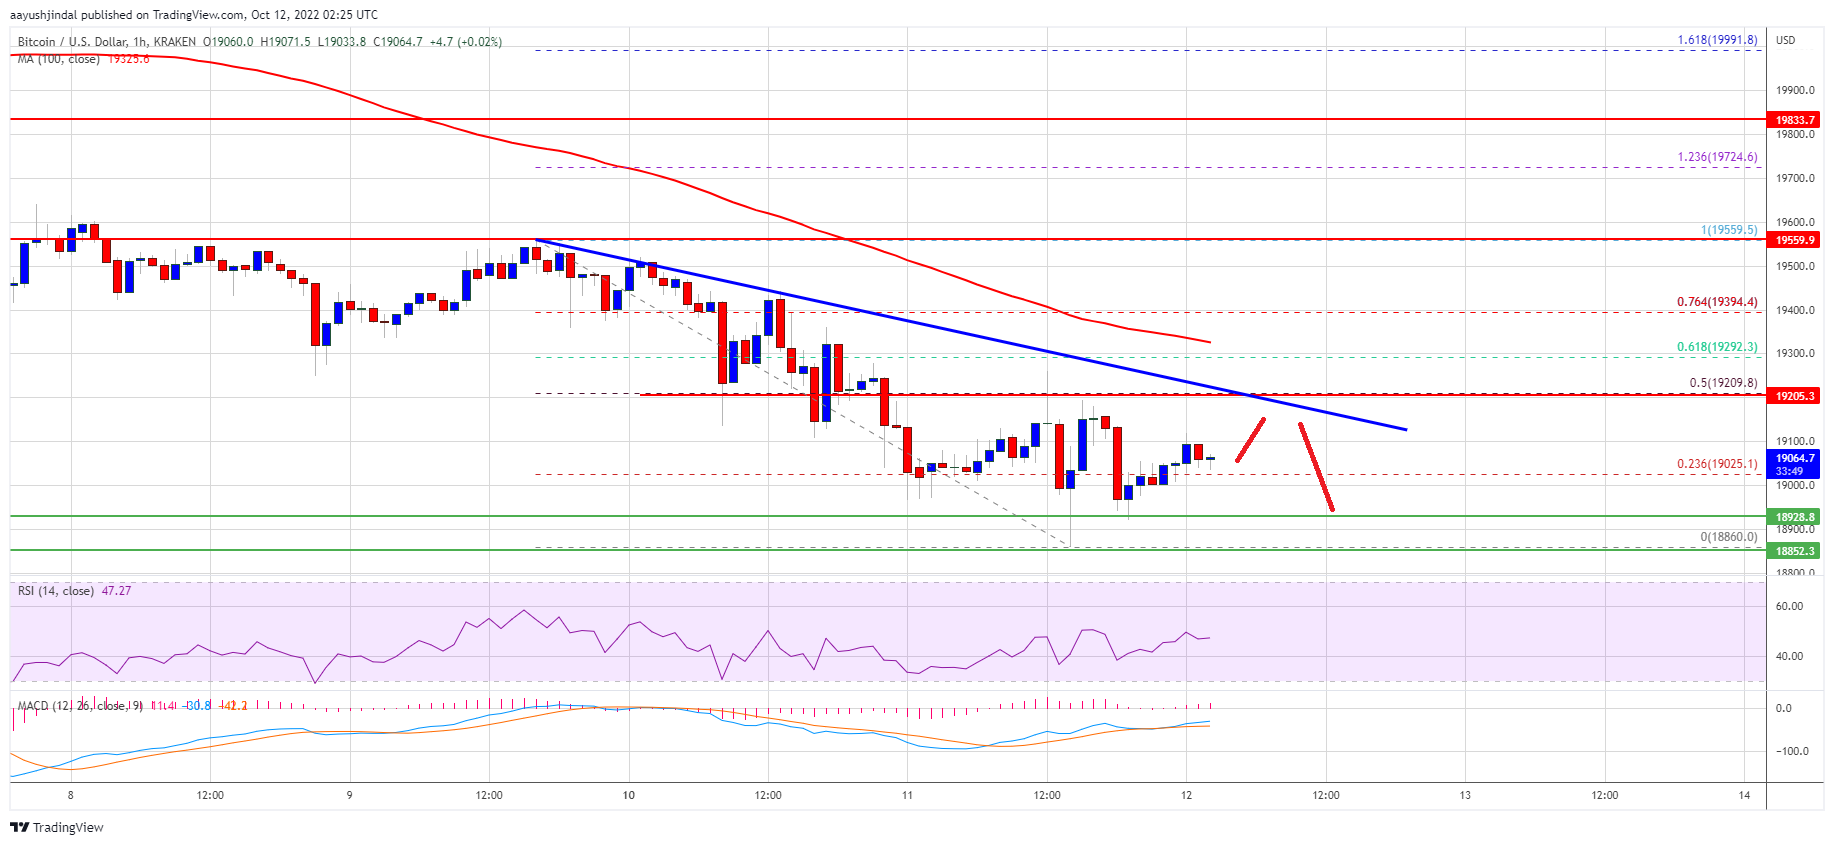
- Bitcoin is showing bearish signs below the $19,200 and $19,500 levels.
- The price is trading below above $19,500 and the 100 hourly simple moving average.
- There is a key bearish trend line forming with resistance near $19,180 on the hourly chart of the BTC/USD pair (data feed from Kraken).
- The pair could continue to move down if it stays below the $19,500 level for a long time.
Bitcoin price settled below the $20,000 support zone. BTC is following a slow and steady decline below the $19,500 pivot level and the 100 hourly simple moving average.
The price even traded below yesterday’s low and tested the $18,850 zone. A low is formed near $18,860 and the price is now consolidating losses. There was a minor recovery wave above the $19,000 resistance level. The price climbed above the 23.6% Fib retracement level of the recent decline from the $19,560 swing high to $18,860 low.
Bitcoin price is now trading below above $19,500 and the 100 hourly simple moving average. On the upside, an immediate resistance is near the $19,200 level.
There is also a key bearish trend line forming with resistance near $19,180 on the hourly chart of the BTC/USD pair. The trend line is near the 50% Fib retracement level of the recent decline from the $19,560 swing high to $18,860 low.
Source: BTCUSD on TradingView.com
A clear move above the trend line might send the price towards the 100 hourly simple moving average or the $19,500 resistance. Any more gains might send the price towards the $20,000 resistance zone.
More Losses in BTC?If bitcoin fails to recover above the $19,200 resistance zone, it could continue to move down. An immediate support on the downside is near the $18,850 zone.
The next major support is near the $18,550 zone. A downside break below the $18,550 support zone might trigger another sharp decline. In the stated case, there is a risk of a move towards the $17,800 support zone.
Technical indicators:
Hourly MACD – The MACD is now gaining pace in the bearish zone.
Hourly RSI (Relative Strength Index) – The RSI for BTC/USD is now near the 50 level.
Major Support Levels – $18,850, followed by $18,550.
Major Resistance Levels – $19,200, $19,500 and $20,000.
Why this matters
This bitcoin story adds another data point to the current market tape and is useful when read alongside nearby source coverage.
Original source
Read on NewsBTCRelated market context

XRP’s $1 rebound faces holders trapped above $2
Glassnode reported that XRP holders who bought between 6 and 12 months ago have an average cost basis near $2.22, roughly 52% abov...

Bitcoin (BTC) Price Prediction: $65.6K Liquidity Sweep Could Decide Whether BTC Retests $60K or Breaks Higher
While short-term technical indicators suggest buyers are attempting to regain momentum, traders remain cautious as mixed signals a...

Bitcoin pushes toward $65,000 on US inflation relief that may already be fading
Bitcoin approached $65,000 on July 14 as a sharper-than-expected slowdown in US inflation weakened the case for another near-term...

Bitcoin Price Prediction: Strategy Has a New BTC Approach
Bitcoin price is trading at $62,900, as we debate whether this pause is simply a reset or something more serious, with bearish pre...

Chart of the Day – Bitcoin Bear Market End In Sight
After a first half of 2026 most holders would rather forget, bitcoin is doing something chartists have been waiting months for: bo...

South Korea’s 8% stock crash set up a crypto rotation but Upbit volume rose just 4%
Crypto and tokenized assets appear to be finding their way into all aspects of finance at the moment. However, when South Korea's...