Bitcoin Price Regains Strength Post Fed Hike, $30K Could Be Next
Bitcoin price is recovering and trading above $29,000. BTC is slowly moving higher and the bulls might soon aim for a move toward the $30,000 resistance. Bitcoin is attempting a recovery wave above the $28,800 resistance...
Archive context
Older archive item. Useful for background and entity history, but not a fresh market-moving signal.

Bitcoin price is recovering and trading above $29,000. BTC is slowly moving higher and the bulls might soon aim for a move toward the $30,000 resistance.
- Bitcoin is attempting a recovery wave above the $28,800 resistance zone.
- The price is trading above $28,800 and the 100 hourly Simple moving average.
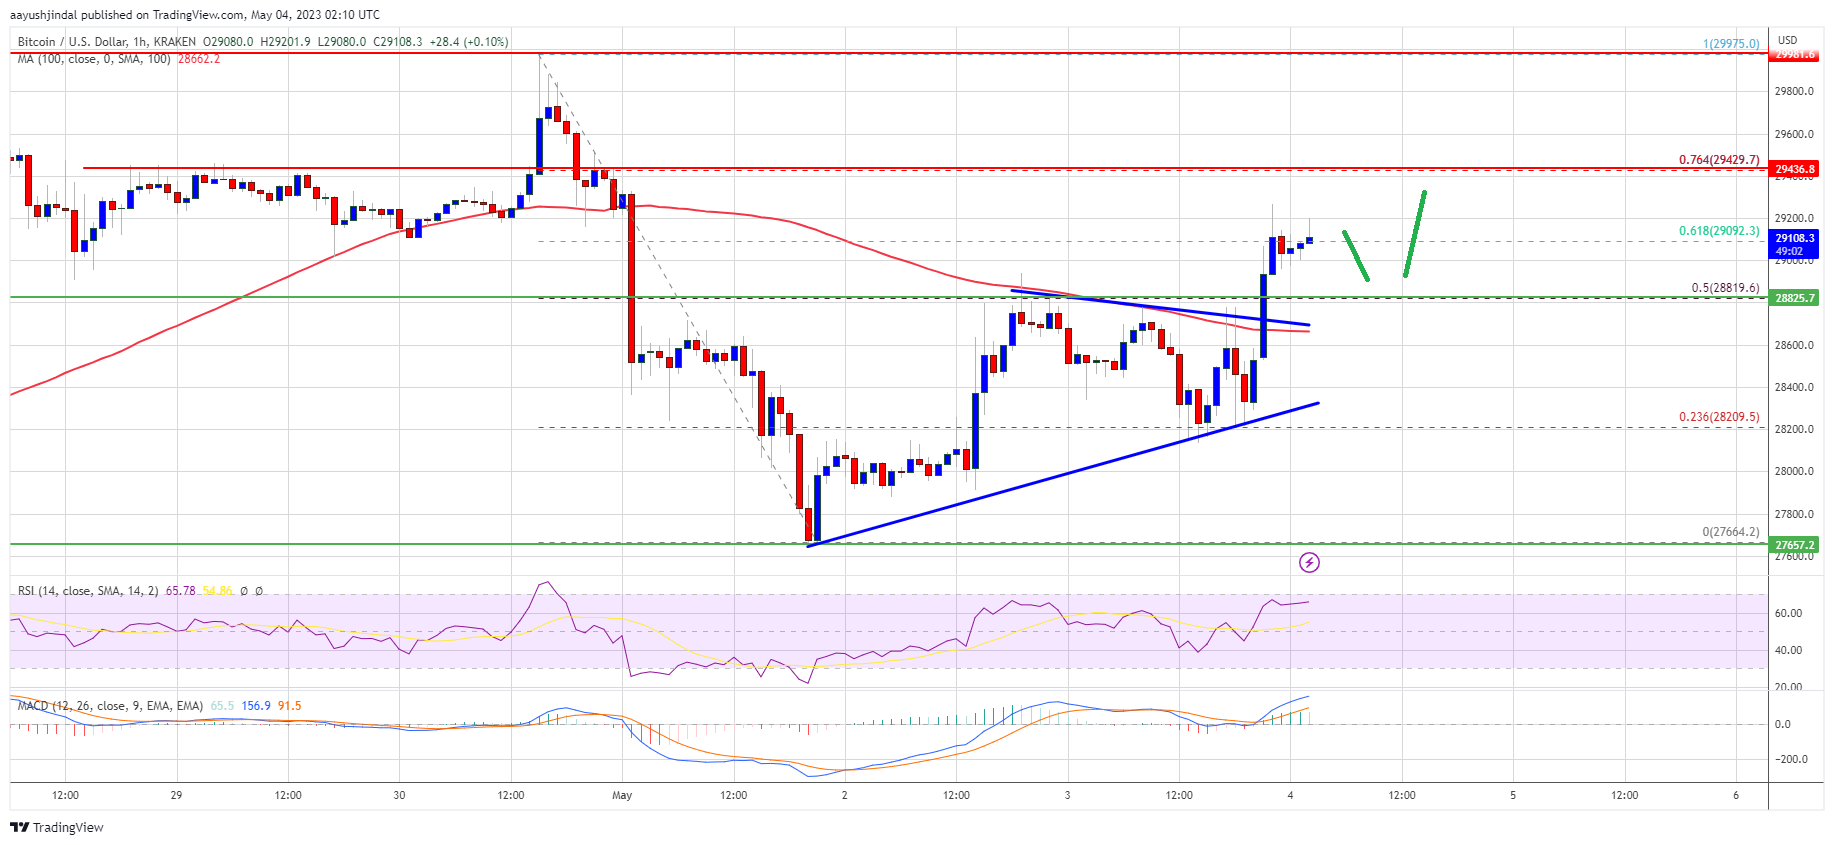
- There was a break above a key contracting triangle with resistance near $28,700 on the hourly chart of the BTC/USD pair (data feed from Kraken).
- The pair could rise further and revisit the $30,000 resistance zone.
Bitcoin price remained well-bid above the $28,000 support zone. BTC started a decent recovery wave above the $28,500 resistance zone. It even broke the $28,800 resistance after the Fed announced another rate hike from 5% to 5.25%.
There was a break above a key contracting triangle with resistance near $28,700 on the hourly chart of the BTC/USD pair. The pair is now trading above $28,800 and the 100 hourly Simple moving average.
Bitcoin price is currently consolidating near the 61.8% Fib retracement level of the main decline from the $29,975 swing high to the $27,664 low. Immediate resistance is near the $29,200 level.
The next major resistance sits near the $29,420 zone. It is close to the 76.4% Fib retracement level of the main decline from the $29,975 swing high to the $27,664 low. A proper move above the $29,420 resistance zone might send the price toward the $30,000 resistance zone.
Source: BTCUSD on TradingView.com
Any more gains could open the doors for a test of the $30,500 resistance. In the stated case, the price may perhaps rise toward the $31,200 level.
Are Dips Supported in BTC?If Bitcoin’s price fails to clear the $29,200 resistance, it could start a downside correction. Immediate support on the downside is near the $28,800 level and the triangle trend line.
The next major support is near the $28,650 zone or the 100 hourly Simple moving average, below which the price might drop toward the $28,400 support zone. Any more losses might take Bitcoin toward the $28,000 level in the near term.
Technical indicators:
Hourly MACD – The MACD is now gaining pace in the bullish zone.
Hourly RSI (Relative Strength Index) – The RSI for BTC/USD is now above the 50 level.
Major Support Levels – $28,800, followed by $28,650.
Major Resistance Levels – $29,200, $29,420, and $30,000.
Why this matters
This bitcoin story adds another data point to the current market tape and is useful when read alongside nearby source coverage.
Original source
Read on NewsBTCRelated market context

Avalanche (AVAX) Price Prediction: AVAX Slips Near $6.71 as ETF Removal, Bearish Patterns, and $6.50 Support Put Bulls Under Pressure
AVAX price is trading near $6.71 after falling around 1% over the past 24 hours, based on Brave New Coin data. The move keeps AVAX...

Hyperliquid (HYPE) Price Prediction: HYPE Holds Above 200 EMA as Fair Value Gap Retest Fuels $92 Outlook
While the Hyperliquid price pulled back from recent highs near $76–$77, several market observers argue that the retracement remain...

XRP Price Prediction: Analyst Maps Rally to $2.55 as Macro Accumulation Zone Holds
While current market indicators point to limited momentum, several chart analysts argue that the XRP price remains within a histor...

Ethereum (ETH) Price Prediction: ETH Slips Towards $1,746 as Bulls Eye $1,800 Breakout and OBV Confirmation
Ethereum is currently trading around $1,746 following a mild pullback over the past 24 hours. The asset has slipped roughly 1.56%...

Bitcoin’s $10 billion credit market keeps growing after its first major selloff
Bitcoin’s more than $10 billion corporate credit market is still attracting new entrants after a June selloff triggered margin cal...

Dogecoin Traders Watch $0.13 As DOGE Reclaims A Key Technical Level
Dogecoin Traders Watch $0.13 as DOGE Reclaims A Key Technical Level is the kind of crypto story that looks simple at headline leve...