Bitcoin Price Rejected $20,000, Have The Bulls Lost Steam Again?
The Bitcoin price surged over the last 24 hours. However, the bulls have lost steam on the chart. The coin gained nearly 4% in the last 24 hours, but most gains were reversed at press time. In the last week, BTC made no...
Archive context
Older archive item. Useful for background and entity history, but not a fresh market-moving signal.

The Bitcoin price surged over the last 24 hours. However, the bulls have lost steam on the chart. The coin gained nearly 4% in the last 24 hours, but most gains were reversed at press time.
In the last week, BTC made no progress in terms of price movement.
Technical indicators were yet to reflect the minor bullish spell as the indicators remained bearish at the time of writing.
On one hand, sellers continue to dominate the market and, on the other hand, the bulls continue to defend the two crucial support levels of the coin.
The current support zone lies between $19,000 and $18,600. If the bulls make a comeback, then the coin can again touch the $20,000 mark.
A move above the $20,000 mark will help Bitcoin price propel above the $25,000 mark. The global cryptocurrency market cap today is $980 billion, with a 1.0% positive change in the last 24 hours.
Bitcoin Price Analysis: One Day Chart Bitcoin was priced at $19,044 on the one-day chart | Source: BTCUSD on TradingViewBTC was trading at $19,044 at the time of writing. The bulls tried hard to take the Bitcoin price above the $20,000 mark, but they failed to. This also signified increased demand at the lower level for the coin.
The overhead resistance for the coin stood at $19,600. If the coin manages to move above the $19,600 mark, it could move to trade at $20,000 again.
For that to happen, the buyers need to assert dominance on the chart. The support level for the coin rested at $19,000. Falling through would bring BTC to $18,600.
The bulls will then have to defend the coin at $17,600 in order for the coin to keep recovering. The amount of Bitcoin traded in the last session decreased, pointing toward a fall in buying strength.
Technical Analysis Bitcoin displayed low buying strength on the one-day chart | Source: BTCUSD on TradingViewBTC’s movement showed that the coin was being dominated by the sellers at press time. The $19,000 price zone remains a high-demand zone.
This could make it harder for the bulls to climb back to the $20,000 price mark. The Relative Strength Index was below the half-line and that points towards a fall in buying strength and increased bearishness.
The Bitcoin price was below the 20-SMA line, and that meant sellers were driving the price momentum in the market. Increased buying strength could help Bitcoin rise above the 20-SMA line, helping the bulls to take over.
Bitcoin depicted sell signal on the one-day chart | Source: BTCUSD on TradingViewBTC’s technical indicators depicted mixed signals on the one-day chart. The Moving Average Convergence Divergence indicated the price momentum and overall price action of the coin.
MACD continued to flash bearish signals with red signal bars, which were sell signal for the coin. On the contrary, the Chaikin Money Flow measures capital inflows and outflows were positive.
CMF continued to remain positive as capital inflows were higher as seen on the indicator. There was a drop in the CMF indicator, which indicates that bears are closing in on Bitcoin.
Featured image from Pexels , Chart: TradingView.comWhy this matters
This bitcoin story adds another data point to the current market tape and is useful when read alongside nearby source coverage.
Original source
Read on NewsBTCRelated market context

Bitcoin Steadies Above $81,000 as Traders Eye Late-October Seasonality and Oil-Driven Macro Noise
Bitcoin steadies above $81,000 as oil volatility grips macro markets and Carson Group's Ryan Detrick flags late-October lows as a...
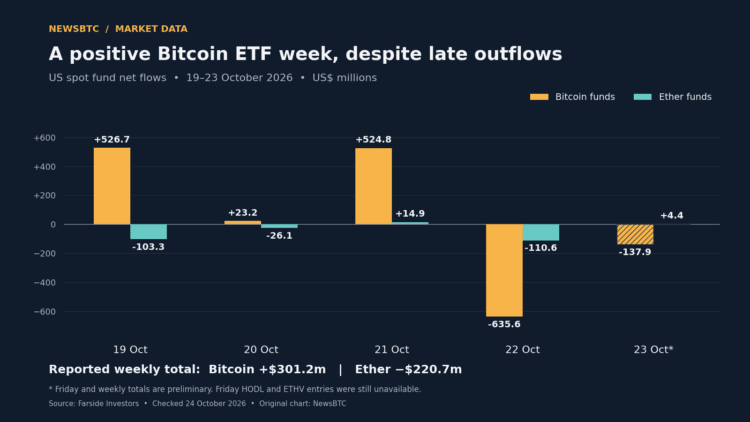
Bitcoin ETF Week Stays Positive After Nearly $774 Million In Late Outflows
TL;DR: Farside’s preliminary figures show US Bitcoin funds retaining a $301.2 million weekly inflow despite two days of withdrawal...
Bitcoin Hashrate Reclaims One Zettahash As Mining Competition Rebounds
TL;DR: BlocksBridge reported Bitcoin’s seven-day hashrate above one zettahash in the week to October 22. Mining competition has re...
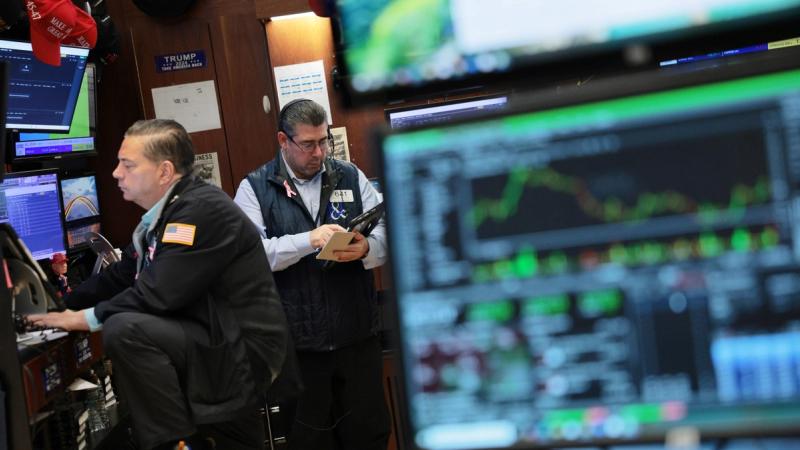
Strategy, Strive face balancing act between bitcoin buying and preferred stock dividends
The securities have financed purchases of nearly 136,000 bitcoin, opening a funding channel that analysts expect to complement the...

Ethereum (ETH) Price Prediction: Whale Rotates $155M Into ETH as Longs Surge Near $2,500
Ethereum is trying to stabilize after another volatile stretch, with price returning toward the mid-$2,400 region while several po...

Bitcoin Bettors Push Kalshi and Polymarket to a Record $2.7B Week
Crypto contracts on Kalshi and Polymarket hit a record $2.7 billion in weekly volume, driven mostly by short-term bets on where bi...