Bitcoin Price Remains at Risk Despite Recent Moves, Indicators Turn Bearish
Bitcoin price extended its losses and traded below the $64,500 level. BTC is correcting losses, but the bears are still in control and aim for more losses. Bitcoin remained in a bearish zone and traded below $64,500. The...
Archive context
Older archive item. Useful for background and entity history, but not a fresh market-moving signal.

Bitcoin price extended its losses and traded below the $64,500 level. BTC is correcting losses, but the bears are still in control and aim for more losses.
- Bitcoin remained in a bearish zone and traded below $64,500.
- The price is trading below $65,500 and the 100 hourly Simple moving average.
- There is a connecting trend line forming with resistance at $65,400 on the hourly chart of the BTC/USD pair (data feed from Kraken).
- The pair remains at risk of more downsides below the $64,000 support zone.
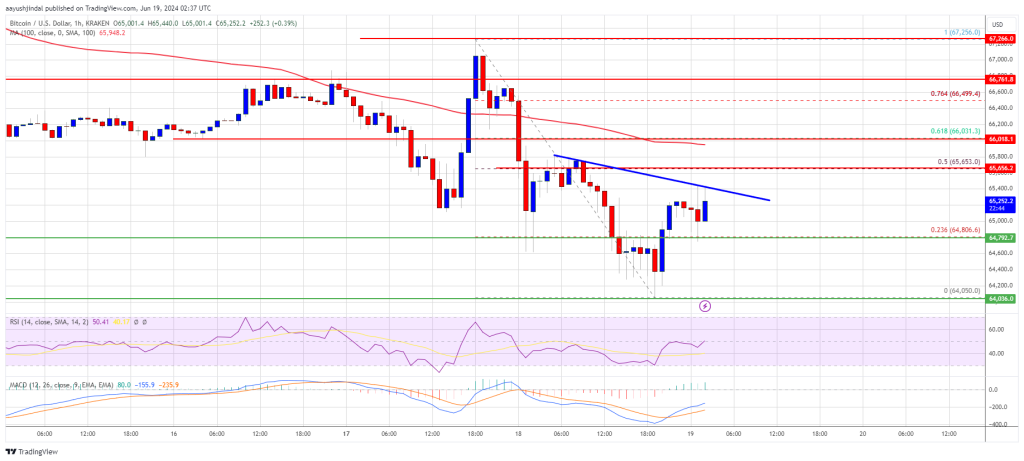
Bitcoin price remained in a bearish zone after it settled below the $66,500 resistance zone. BTC extended losses and traded below the $65,000 level. There was also a dip below $64,500.
A low was formed at $64,050 and the price is now correcting losses. There was a minor recovery above the $64,500 level. The price climbed above the 23.6% Fib retracement level of the downward wave from the $67,255 swing high to the $64,050 low.
Bitcoin is now trading below $65,500 and the 100 hourly Simple moving average. There is also a connecting trend line forming with resistance at $65,400 on the hourly chart of the BTC/USD pair.
On the upside, the price is facing resistance near the $65,500 level and the trend line. The first major resistance could be $65,650 or the 50% Fib retracement level of the downward wave from the $67,255 swing high to the $64,050 low. The next key resistance could be $66,000.
A clear move above the $66,000 resistance might start a decent increase and send the price higher. In the stated case, the price could rise and test the $66,500 resistance. Any more gains might send BTC toward the $67,500 resistance in the near term.
More Losses In BTC?If Bitcoin fails to climb above the $65,400 resistance zone, it could start another decline. Immediate support on the downside is near the $64,800 level.
The first major support is $64,200. The next support is now forming near $64,000. Any more losses might send the price toward the $63,200 support zone in the near term.
Technical indicators:
Hourly MACD – The MACD is now losing pace in the bearish zone.
Hourly RSI (Relative Strength Index) – The RSI for BTC/USD is now near the 50 level.
Major Support Levels – $64,500, followed by $64,000.
Major Resistance Levels – $65,400, and $66,000.
Why this matters
This bitcoin story adds another data point to the current market tape and is useful when read alongside nearby source coverage.
Original source
Read on NewsBTCRelated market context

Bitcoin (BTC) Price Prediction: BTC Holds $63K Support—Can Rising Active Addresses Offset Bearish Technical Signals?
Although the BTC price has remained near a key support zone, recent chart signals and Strategy’s sale of a portion of its Bitcoin...

Bitcoin price rebounds to $63K as leverage returns creating short term volatility risk
Bitcoin's rebound has cleared the first test: price recovered. The harder one starts now: proving buyers remain after the squeeze....

New SummerFi DeFi exploit shows AI automation now sits above smart contract risk
Summer.fi's automated vault incident has put delegated DeFi yield back under pressure after Blockaid said on July 6 that its explo...

Vitalik Buterin Proposes ‘Extremely Lean’ Ethereum That Cuts Validator State by 95% Using ZK Proofs
Ethereum co-founder Vitalik Buterin published a technical proposal Monday called “The Extremely Lean Chain,” outlining a two-phase...

‘Privacy Is No Longer an Afterthought’: Vitalik Buterin Unveils 3-4 Year Plan to Rebuild Ethereum
Ethereum co-founder Vitalik Buterin has published a “Lean Ethereum” roadmap that would replace nearly every major component of the...

Bitcoin miner bottom signal now depends on who survives weak mining profits
A Bitcoin miner-stress signal circulating on X has fallen into a zone analysts associate with severe miner pressure, putting a fam...