Bitcoin Price Remains In Bullish Zone For A Push To $18K, Here’s Why
Bitcoin price started a downside correction from the $17,000 resistance. BTC found support near $16,750 and might soon attempt an upside break above $17,000. Bitcoin is showing bullish signs above the $16,600 and $16,750...
Archive context
Older archive item. Useful for background and entity history, but not a fresh market-moving signal.

Bitcoin price started a downside correction from the $17,000 resistance. BTC found support near $16,750 and might soon attempt an upside break above $17,000.
- Bitcoin is showing bullish signs above the $16,600 and $16,750 levels.
- The price is trading above $16,750 and the 100 hourly simple moving average.
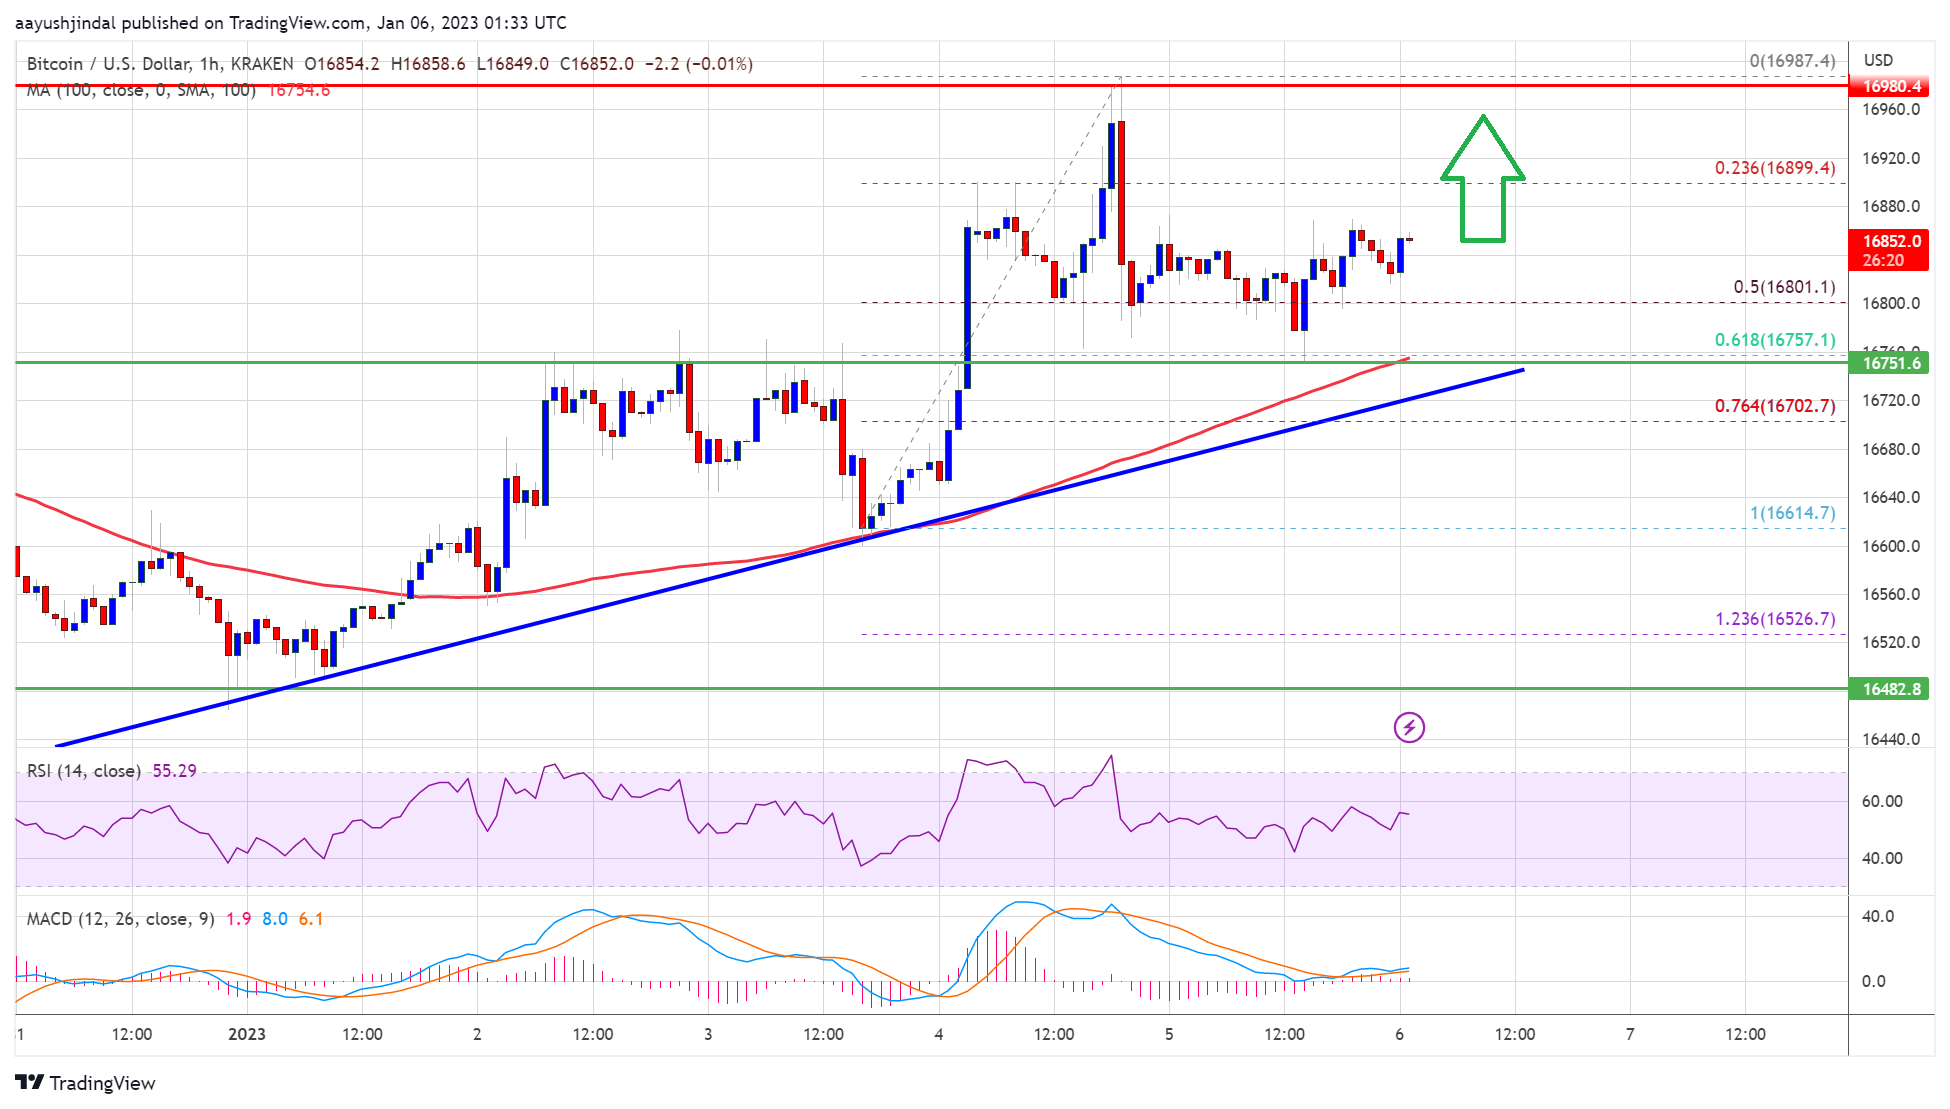
- There is a crucial bullish trend line forming with support near $16,750 on the hourly chart of the BTC/USD pair (data feed from Kraken).
- The pair could start a strong increase if there is a close above the $17,000 resistance.
Bitcoin price attempted a decent upward move above the $16,800 resistance level. BTC even spiked towards the $17,000 resistance zone, but there was no clear upside break.
A high was formed near $16,987 and the price started a downside correction. There was a move below the $16,800 support zone. The price declined below the 50% Fib retracement level of the upward move from the $16,615 swing low to $16,987 high.
However, bitcoin price found support near the $16,750 level. The 61.8% Fib retracement level of the upward move from the $16,615 swing low to $16,987 high is acting as a support.
There is also a crucial bullish trend line forming with support near $16,750 on the hourly chart of the BTC/USD pair. The pair is stable above $16,750 and the 100 hourly simple moving average. On the upside, an immediate resistance is near the $16,900 level.
Source: BTCUSD on TradingView.com
The next major resistance is near the $17,000 zone. A clear move and close above the $17,000 resistance might start a strong increase in the near term. In the stated case, the price may perhaps rise towards the $17,550 level. Any more gains might call for a move towards the $18,000 level.
Dips Supported in BTC?If bitcoin price fails to clear the $17,000 resistance, it could start a downside correction. An immediate support on the downside is near the $16,800 level.
The next major support is near the $16,750 level and the trend line. A downside break below the $16,750 support might send the price towards the $16,500 level. Any more losses might call for a test of $16,350.
Technical indicators:
Hourly MACD – The MACD is now gaining pace in the bullish zone.
Hourly RSI (Relative Strength Index) – The RSI for BTC/USD is now above the 50 level.
Major Support Levels – $16,750, followed by $16,700.
Major Resistance Levels – $16,900, $17,000 and $17,500.
Why this matters
This bitcoin story adds another data point to the current market tape and is useful when read alongside nearby source coverage.
Original source
Read on NewsBTCRelated market context

Ethereum (ETH) Price Prediction: ETH Eyes $2,100 as ETF Inflows Return and Whale Demand Builds
Ethereum price is trading near $1,785 after a modest 24-hour recovery, but the market is now watching whether fresh inflows and wh...

XRP Price Prediction: Bears Eye $1 Support as Whale Activity Suddenly Collapses
While Ripple XRP is still holding above the psychologically important $1 level, analysts are closely monitoring whether buyers can...

XRP Price Prediction: Key Metrics Point to a Crash
XRP prediction chatter is heating up even as the price slips, which is usually when markets like to play tricks. XRP trades at aro...

Ethereum Price Prediction: Robinhood Chain Leads Ethereum’s Biggest User Onboarding Wave
Price prediction debates are heating up as Ethereum trades at $1,790 and is slipping in trading volume. Still, Robinhood Chain kee...

Bitcoin Price Prediction: Strategy Has a New BTC Approach
Bitcoin price is trading at $62,900, as we debate whether this pause is simply a reset or something more serious, with bearish pre...

Microsoft Copilot AI Predicts Insane XRP Price by End Of 2026
Microsoft Copilot AI just dropped one of the most updated rich XRP price predictions in this series, pulling in a July 2026 data p...