Bitcoin Price Resumes Rally, Another 5% Increase On The Cards?
Bitcoin price cleared the key $35,000 resistance. BTC is showing positive signs and might rally toward the $36,200 and $37,000 levels in the near term. Bitcoin is gaining pace above the $35,000 resistance. The price is t...
Archive context
Older archive item. Useful for background and entity history, but not a fresh market-moving signal.

Bitcoin price cleared the key $35,000 resistance. BTC is showing positive signs and might rally toward the $36,200 and $37,000 levels in the near term.
- Bitcoin is gaining pace above the $35,000 resistance.
- The price is trading above $35,000 and the 100 hourly Simple moving average.
- There was a break above a rising channel with resistance at $34,850 on the hourly chart of the BTC/USD pair (data feed from Kraken).
- The pair is showing positive signs and might rise toward the $37,000 resistance in the near term.
Bitcoin price remained well-bid above the $34,000 support zone. BTC formed a base, completed a consolidation phase, and recently started a decent increase above the $34,750 resistance.
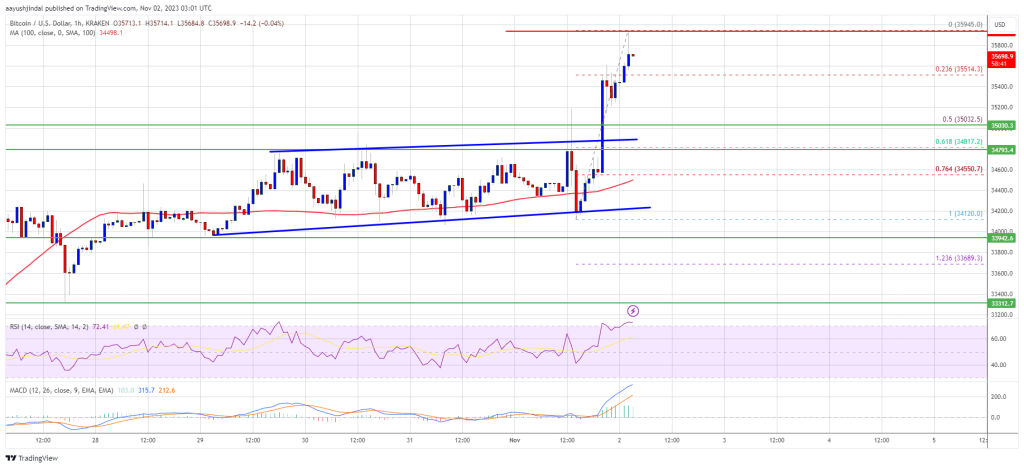
There was a break above a rising channel with resistance at $34,850 on the hourly chart. The bulls were able to pump the price above the last swing high and $35,500. It traded to a new multi-week high at $35,945 and is still showing positive signs.
Bitcoin is now trading above $34,260 and the 100 hourly Simple moving average. It is also well above the 23.6% Fib retracement level of the recent increase from the $34,120 swing low to the $35,945 high.
On the upside, immediate resistance is near the $35,950 level. The next key resistance could be near $36,200. A clear move above the $36,200 resistance might open the doors for a decent 5% increase toward the $37,000 resistance.
Source: BTCUSD on TradingView.com
The next key resistance could be $37,500, above which the price could rise toward $38,000. Any more gains might send BTC toward the $38,800 level.
Are Dips Limited In BTC?If Bitcoin fails to rise above the $35,950 resistance zone, it could start a downside correction. Immediate support on the downside is near the $35,500 level.
The next major support is near the $35,000 level or the 50% Fib retracement level of the recent increase from the $34,120 swing low to the $35,945 high. If there is a move below $35,000, there is a risk of more downsides. In the stated case, the price could drop toward the $34,500 level or the 100 hourly Simple moving average.
Technical indicators:
Hourly MACD – The MACD is now gaining pace in the bullish zone.
Hourly RSI (Relative Strength Index) – The RSI for BTC/USD is now in the overbought zone.
Major Support Levels – $35,500, followed by $35,000.
Major Resistance Levels – $35,950, $36,200, and $37,000.
Why this matters
This bitcoin story adds another data point to the current market tape and is useful when read alongside nearby source coverage.
Original source
Read on NewsBTCRelated market context

Bitcoin (BTC) Price Prediction: $65K Remains Key Resistance as 4-Year Cycle Model Signals Make-or-Break Moment
The Bitcoin price today remains around $62,600-$62,900, according to TradingView data, reflecting a market that has stabilized fol...

Litecoin (LTC) Price Prediction: Mixed Technical Signals and Growing Hashrate Keep Traders Focused on $39 Support and $46 Breakout
Analysts are closely watching whether the Litecoin price can maintain support around $39 and break above the key $46 resistance le...

US-Iran military strikes shatter ceasefire, sending Bitcoin sliding toward $60K
The renewed US-Iran conflict heightens geopolitical instability, impacting global markets and highlighting Bitcoin's sensitivity t...

Micron’s trillion-dollar valuation puzzle: why the cheapest-looking chip stock might matter for crypto
Micron's valuation surge highlights potential shifts in crypto's hardware dependencies, signaling evolving market dynamics and inv...

Norway’s World Cup hotel drama highlights crypto’s growing grip on global football
Crypto's integration into global football is deepening, enhancing fan engagement and brand visibility, while boosting speculative...

Public companies bought 110,000 Bitcoin in Q2 2026, nearly doubling their prior two-quarter haul
Corporate Bitcoin accumulation outpacing mining could tighten supply, heightening market volatility and systemic risk from potenti...