Bitcoin Price Saw Increase In Volatility, Here’s Why The Bulls Are Safe
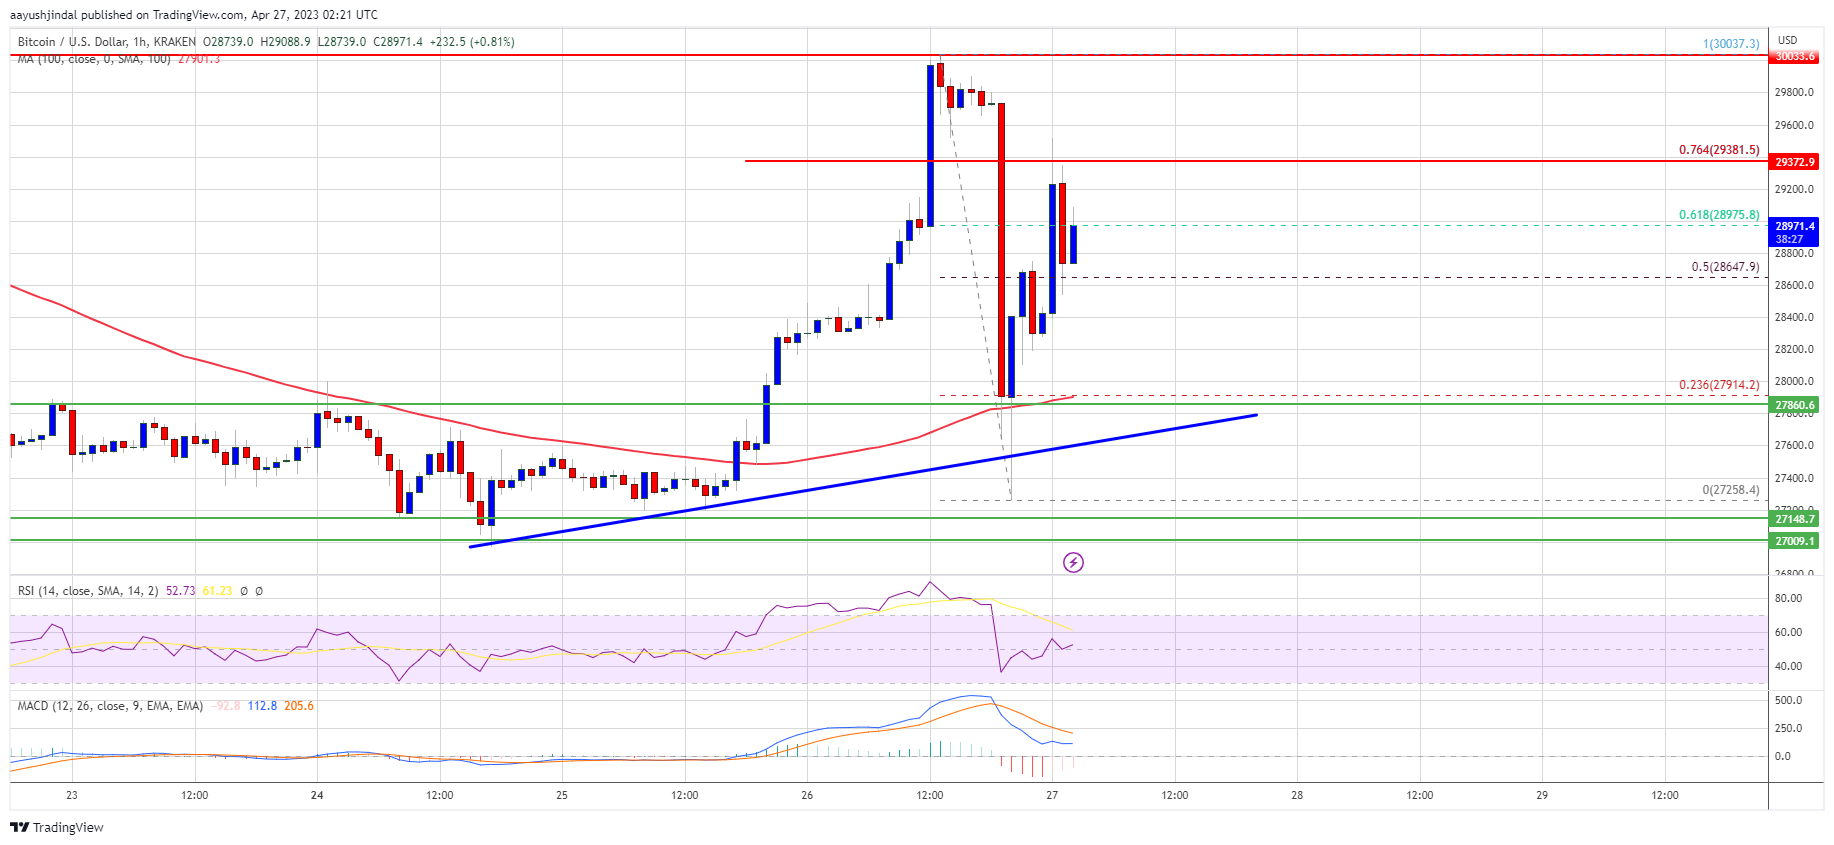
Bitcoin price saw a couple of wild moves above the $28,500 pivot level. BTC is now rising and showing positive signs above the $28,800 level. Bitcoin climbed sharply and then nosedived to revisit the $27,250 support. The...
Archive context
Older archive item. Useful for background and entity history, but not a fresh market-moving signal.

Bitcoin price saw a couple of wild moves above the $28,500 pivot level. BTC is now rising and showing positive signs above the $28,800 level.
- Bitcoin climbed sharply and then nosedived to revisit the $27,250 support.
- The price is trading above $28,000 and the 100 hourly Simple moving average.
- There is a key bullish trend line forming with support near $27,800 on the hourly chart of the BTC/USD pair (data feed from Kraken).
- The pair could continue to rise if it clears the $29,400 and $29,500 resistance levels.
Bitcoin price started a major increase from the $27,000 support zone. BTC climbed over $2,000 and broke the $29,250 resistance zone. It even tested the $30,000 resistance before the bears appeared.
There was a sharp decline from the $30,037 high. Bitcoin dived over $2,000 and retested the $27,250 support where the bulls emerged. The price is now rising and trading above $28,000. It is also above $28,200 and the 100 hourly Simple moving average. Besides, there is a key bullish trend line forming with support near $27,800 on the hourly chart of the BTC/USD pair.
The bulls pushed the price above the 50% Fib retracement level of the downward move from the $30,037 swing high to the $27,258 low. Immediate resistance is near the $29,400 level.
Source: BTCUSD on TradingView.com
The 76.4% Fib retracement level of the downward move from the $30,037 swing high to the $27,258 low is also near the $29,400 zone. The next major resistance sits near the $29,500 zone. A close above the $29,500 resistance could send Bitcoin toward $30,000. Any more gains could open the doors for a test of the key barrier at $31,000.
Fresh Decline in BTC?If Bitcoin’s price fails to clear the $29,400 resistance, it could again start a fresh decline. Immediate support on the downside is near the $28,650 level.
The next major support is near the $28,000 zone or the trend line. A downside break and close below the $28,000 support might push the price toward the $27,500 support. Any more losses might take Bitcoin toward $27,250.
Technical indicators:
Hourly MACD – The MACD is now gaining pace in the bullish zone.
Hourly RSI (Relative Strength Index) – The RSI for BTC/USD is now above the 50 level.
Major Support Levels – $28,650, followed by $28,000.
Major Resistance Levels – $29,400, $29,500, and $30,000.
Why this matters
This bitcoin story adds another data point to the current market tape and is useful when read alongside nearby source coverage.
Original source
Read on NewsBTCRelated market context

Avalanche (AVAX) Price Prediction: AVAX Slips Near $6.71 as ETF Removal, Bearish Patterns, and $6.50 Support Put Bulls Under Pressure
AVAX price is trading near $6.71 after falling around 1% over the past 24 hours, based on Brave New Coin data. The move keeps AVAX...

Ethereum (ETH) Price Prediction: ETH Slips Towards $1,746 as Bulls Eye $1,800 Breakout and OBV Confirmation
Ethereum is currently trading around $1,746 following a mild pullback over the past 24 hours. The asset has slipped roughly 1.56%...

XRP Price Prediction: Analyst Maps Rally to $2.55 as Macro Accumulation Zone Holds
While current market indicators point to limited momentum, several chart analysts argue that the XRP price remains within a histor...

Hyperliquid (HYPE) Price Prediction: HYPE Holds Above 200 EMA as Fair Value Gap Retest Fuels $92 Outlook
While the Hyperliquid price pulled back from recent highs near $76–$77, several market observers argue that the retracement remain...

Dogecoin Traders Watch $0.13 As DOGE Reclaims A Key Technical Level
Dogecoin Traders Watch $0.13 as DOGE Reclaims A Key Technical Level is the kind of crypto story that looks simple at headline leve...

Elon Musk Grok AI Predicts XRP Will Explode by End of 2026
Elon Musk Grok AI just cataloged every major institutional development in the XRP ecosystem and arrived at one of the cleaner year...