Bitcoin Price Sees Technical Correction But The Bulls Are Not Done Yet
Bitcoin price extended its increase toward the $28,500 resistance. BTC corrected gains and is currently holding a key support at $27,350. Bitcoin climbed further higher above the $28,000 and $28,200 resistance levels. Th...
Archive context
Older archive item. Useful for background and entity history, but not a fresh market-moving signal.

Bitcoin price extended its increase toward the $28,500 resistance. BTC corrected gains and is currently holding a key support at $27,350.
- Bitcoin climbed further higher above the $28,000 and $28,200 resistance levels.
- The price is trading above $27,400 and the 100 hourly Simple moving average.
- There is a major bullish trend line forming with support near $27,400 on the hourly chart of the BTC/USD pair (data feed from Kraken).
- The pair could start another increase unless there is a move below the $26,650 support.
Bitcoin price started a decent increase above the $27,200 resistance zone. BTC climbed higher steadily above the $27,500 and $28,000 resistance levels.
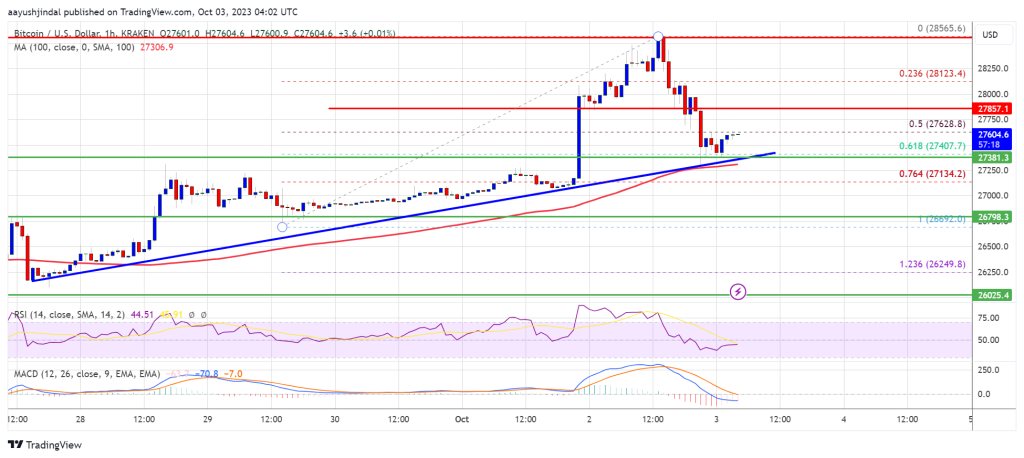
The price tested the $28,500 resistance. A new multi-week high was formed near $28,565 before it saw a downside correction. Finally, the price saw a downside correction below the $28,200 and $28,000 levels. It even moved below the 50% Fib retracement level of the upward move from the $26,690 swing low to the $28,565 high.
Bitcoin is still trading above $27,400 and the 100 hourly Simple moving average. Besides, there is a major bullish trend line forming with support near $27,400 on the hourly chart of the BTC/USD pair.
Immediate resistance on the upside is near the $27,850 level. The next key resistance could be near the $28,000 level. A close above the $28,000 resistance could start another increase.
Source: BTCUSD on TradingView.com
In the stated case, the price could climb toward the $28,500 resistance. Any more gains might call for a move toward the $29,200 level.
More Losses In BTC?If Bitcoin fails to continue higher above the $28,000 resistance, there could be more downsides. Immediate support on the downside is near the $27,400 level and the trend line.
The next major support is near the $27,250 level or the 100 SMA. A downside break and close below the $27,250 level might send the price toward $26,800. The next support sits at $26,650. Any more losses might call for a test of $26,000.
Technical indicators:
Hourly MACD – The MACD is now losing pace in the bullish zone.
Hourly RSI (Relative Strength Index) – The RSI for BTC/USD is now below the 50 level.
Major Support Levels – $27,250, followed by $26,650.
Major Resistance Levels – $28,000, $28,500, and $29,200.
Why this matters
This bitcoin story adds another data point to the current market tape and is useful when read alongside nearby source coverage.
Original source
Read on NewsBTCRelated market context

Bitcoin (BTC) Price Prediction: $65K Remains Key Resistance as 4-Year Cycle Model Signals Make-or-Break Moment
The Bitcoin price today remains around $62,600-$62,900, according to TradingView data, reflecting a market that has stabilized fol...

Ethereum Price Prediction: Tom Lee Predicts $5 Trillion Ethereum
Ethereum price prediction is back in focus after Fundstrat co-founder Tom Lee floated a $5 trillion network valuation. ETH trades...

Litecoin (LTC) Price Prediction: Mixed Technical Signals and Growing Hashrate Keep Traders Focused on $39 Support and $46 Breakout
Analysts are closely watching whether the Litecoin price can maintain support around $39 and break above the key $46 resistance le...

XRP Price Prediction: Analyst Maps Rally to $2.55 as Macro Accumulation Zone Holds
While current market indicators point to limited momentum, several chart analysts argue that the XRP price remains within a histor...

Dogecoin Traders Watch $0.13 As DOGE Reclaims A Key Technical Level
Dogecoin Traders Watch $0.13 as DOGE Reclaims A Key Technical Level is the kind of crypto story that looks simple at headline leve...

Vitalik Buterin’s Single Slot Finality Plan Shows Ethereum Still Has A Settlement-Speed Problem To Solve
Vitalik Buterin’s Single Slot Finality Plan Shows Ethereum Still Has A Settlement-Speed Problem To Solve is the kind of crypto sto...