Bitcoin Price Sets Up for Another Move—Can the Bulls Seal the Deal?
Bitcoin price is eyeing a fresh increase above the $118,000 resistance. BTC must clear the $120,000 resistance zone to continue higher in the near term. Bitcoin started a fresh increase after it cleared the $118,000 zone...
Archive context
Older archive item. Useful for background and entity history, but not a fresh market-moving signal.

Bitcoin price is eyeing a fresh increase above the $118,000 resistance. BTC must clear the $120,000 resistance zone to continue higher in the near term.
- Bitcoin started a fresh increase after it cleared the $118,000 zone.
- The price is trading above $118,500 and the 100 hourly Simple moving average.
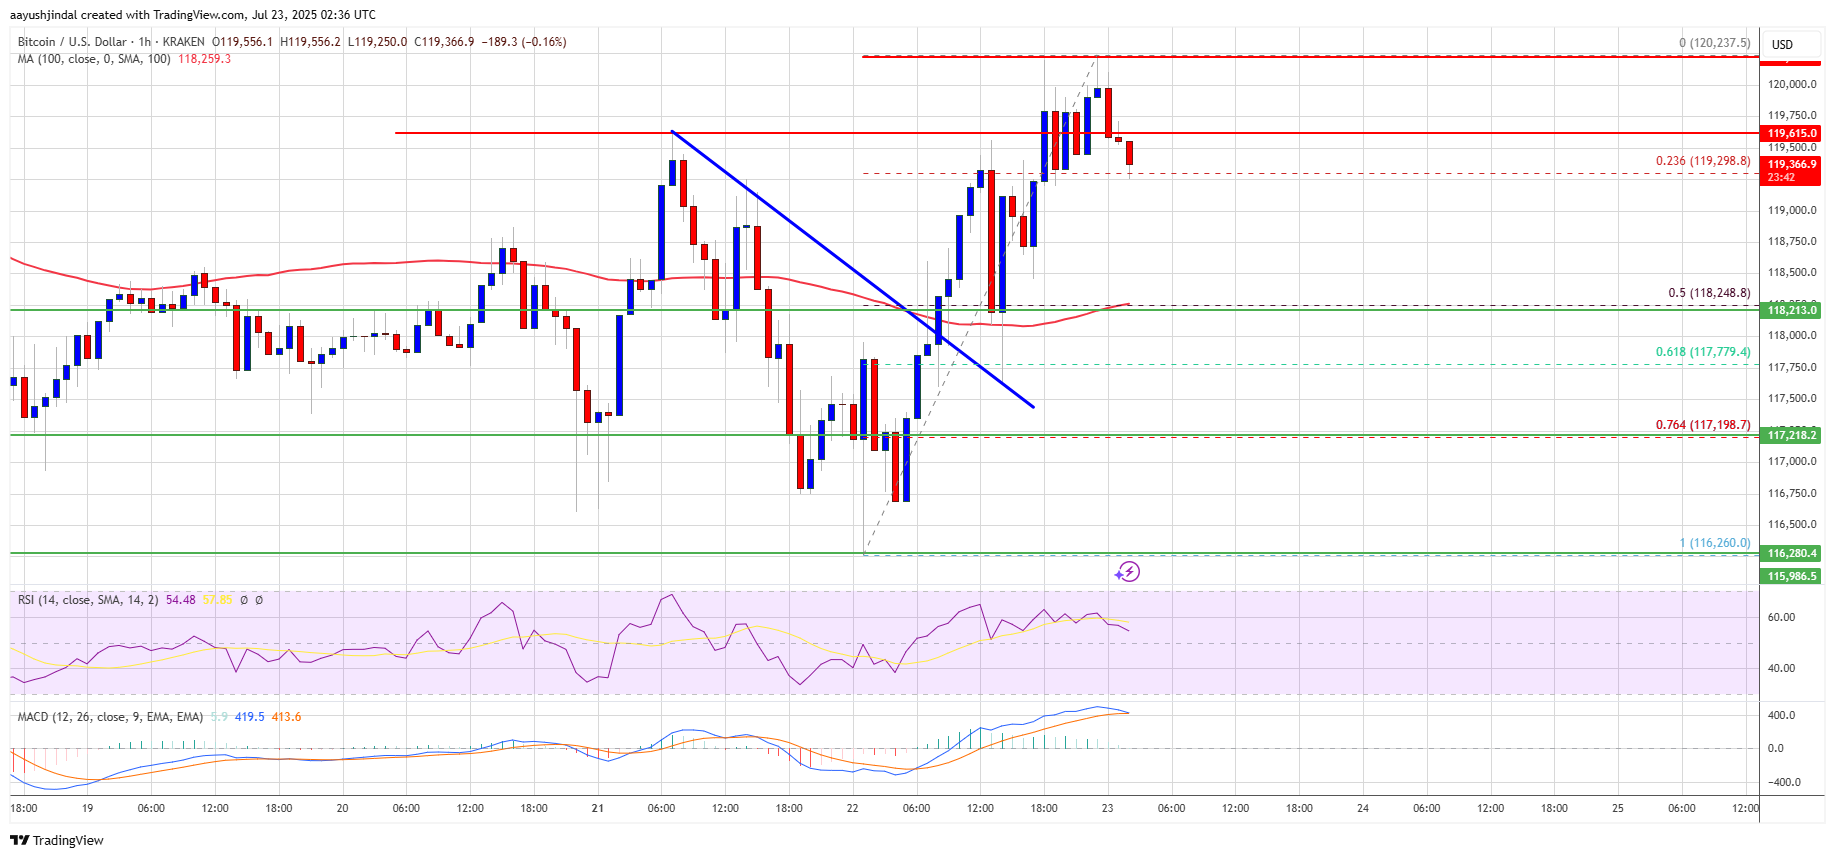
- There was a break above a bearish trend line with resistance at $118,000 on the hourly chart of the BTC/USD pair (data feed from Kraken).
- The pair might start another increase if it clears the $120,000 resistance zone.
Bitcoin price started a correction phase below the $118,500 support zone. BTC dipped below the $118,000 level and tested the $116,200 zone.
A low was formed at $116,260 and the price started another increase. There was a decent move above the $118,000 and $118,500 levels. Besides, there was a break above a bearish trend line with resistance at $118,000 on the hourly chart of the BTC/USD pair.
However, the pair struggled to surpass the $120,000 resistance zone. A high was formed near $120,237 and the price is now consolidating gains near the 23.6% Fib retracement level of the upward move from the $116,260 swing low to the $120,237 high.
Bitcoin is now trading above $118,500 and the 100 hourly Simple moving average. Immediate resistance on the upside is near the $119,800 level. The first key resistance is near the $120,200 level.
The next resistance could be $121,000. A close above the $121,000 resistance might send the price further higher. In the stated case, the price could rise and test the $122,500 resistance level. Any more gains might send the price toward the $122,500 level. The main target could be $123,200.
Another Drop In BTC?If Bitcoin fails to rise above the $120,200 resistance zone, it could start another decline. Immediate support is near the $119,200 level. The first major support is near the $118,500 level.
The next support is now near the $118,200 zone. Any more losses might send the price toward the $116,500 support in the near term. The main support sits at $115,000, below which BTC might continue to move down.
Technical indicators:
Hourly MACD – The MACD is now losing pace in the bullish zone.
Hourly RSI (Relative Strength Index) – The RSI for BTC/USD is now above the 50 level.
Major Support Levels – $119,200, followed by $118,500.
Major Resistance Levels – $120,200 and $121,000.
Why this matters
This bitcoin story adds another data point to the current market tape and is useful when read alongside nearby source coverage.
Original source
Read on NewsBTCRelated market context

Bitcoin (BTC) Price Prediction: BTC Holds $63K Support—Can Rising Active Addresses Offset Bearish Technical Signals?
Although the BTC price has remained near a key support zone, recent chart signals and Strategy’s sale of a portion of its Bitcoin...

Bitcoin price rebounds to $63K as leverage returns creating short term volatility risk
Bitcoin's rebound has cleared the first test: price recovered. The harder one starts now: proving buyers remain after the squeeze....

Bitcoin miner bottom signal now depends on who survives weak mining profits
A Bitcoin miner-stress signal circulating on X has fallen into a zone analysts associate with severe miner pressure, putting a fam...

Bitcoin needs trillions to go parabolic again as ETF demand fades
Bitcoin’s next major rally may depend less on whether investors still believe in the asset than on whether enough large balance sh...

Coinbase enables full trading for GROVE-USD pair with all order types
Coinbase's full trading support for GROVE-USD could enhance liquidity and investor confidence, potentially boosting DeFi adoption...

New SummerFi DeFi exploit shows AI automation now sits above smart contract risk
Summer.fi's automated vault incident has put delegated DeFi yield back under pressure after Blockaid said on July 6 that its explo...