Bitcoin Price Still Vulnerable Unless It Surges Past $26,500
Bitcoin price is attempting an upside break above the $26,200 resistance. BTC must clear $26,200 and $26,500 to start a decent recovery wave. Bitcoin is still struggling to clear the $26,500 resistance zone. The price is...
Archive context
Older archive item. Useful for background and entity history, but not a fresh market-moving signal.

Bitcoin price is attempting an upside break above the $26,200 resistance. BTC must clear $26,200 and $26,500 to start a decent recovery wave.
- Bitcoin is still struggling to clear the $26,500 resistance zone.
- The price is trading above $26,000 and the 100 hourly Simple moving average.
- There was a break above a short-term bearish trend line with resistance near $26,000 on the hourly chart of the BTC/USD pair (data feed from Kraken).
- The pair could attempt a fresh increase if it clears $26,200 and $26,500.
Bitcoin price started a short-term upward move from the $25,720 zone. BTC was able to climb above the $26,000 resistance zone but it is still facing a lot of hurdles.
During the recent increase, it broke the 23.6% Fib retracement level of the downward move from the $26,779 swing high to the $25,778 low. Besides, there was a break above a short-term bearish trend line with resistance near $26,000 on the hourly chart of the BTC/USD pair.
Bitcoin is now trading above $26,000 and the 100 hourly Simple moving average. On the upside, immediate resistance is near the $26,175 and $26,200 levels.
A clear move above the $26,200 level might send the price toward the key resistance at $26,500. Intermediate resistance is near the 61.8% Fib retracement level of the downward move from the $26,779 swing high to the $25,778 low at $26,400.
Source: BTCUSD on TradingView.com
To start a decent increase, the price must settle above $26,500. In the stated case, the price could test the $27,000 level. Any more gains might set the pace for a larger increase toward $28,200.
Fresh Decline In BTC?If Bitcoin fails to clear the $26,200 resistance, it could start another decline. Immediate support on the downside is near the $25,900 level.
The next major support is near the $25,800 level. A downside break below the $25,800 level might push the price further lower. In the stated case, the price could drop toward $25,400.
Technical indicators:
Hourly MACD – The MACD is now losing pace in the bullish zone.
Hourly RSI (Relative Strength Index) – The RSI for BTC/USD is now above the 50 level.
Major Support Levels – $25,800, followed by $25,400.
Major Resistance Levels – $26,200, $26,500, and $27,000.
Why this matters
This bitcoin story adds another data point to the current market tape and is useful when read alongside nearby source coverage.
Original source
Read on NewsBTCRelated market context

XRP Price Prediction: Analyst Maps Rally to $2.55 as Macro Accumulation Zone Holds
While current market indicators point to limited momentum, several chart analysts argue that the XRP price remains within a histor...

Sam Altman ChatGPT AI Predicts Bitcoin Price Will Shock Everyone by End Of 2026
Sam Altman ChatGPT AI just delivered the most institutionally detailed Bitcoin price prediction bull case in this entire series. T...

Dogecoin Traders Watch $0.13 As DOGE Reclaims A Key Technical Level
Dogecoin Traders Watch $0.13 as DOGE Reclaims A Key Technical Level is the kind of crypto story that looks simple at headline leve...
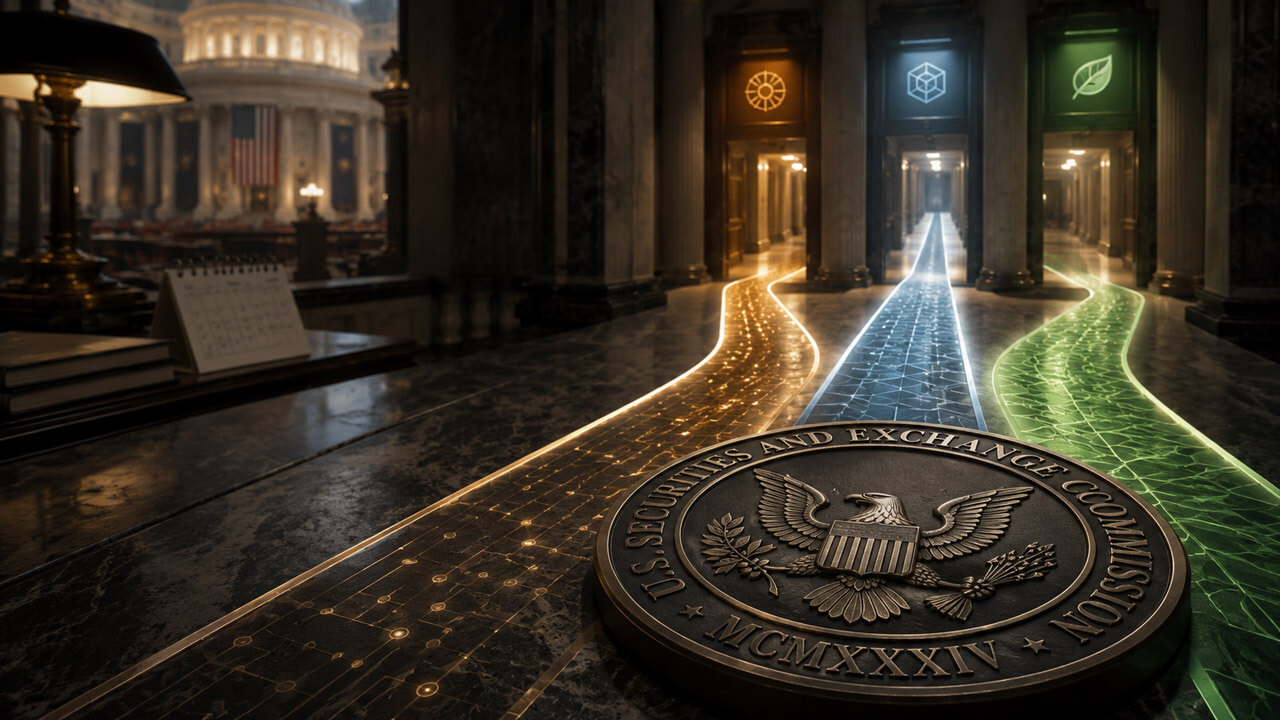
SEC could start writing crypto rules before the Senate votes on CLARITY
Three SEC crypto proposals are now penciled in for July, covering token offerings, broker-dealer custody and trading venues. The a...

SWIFT Crypto Ledger Targets Settlement Dead Zones With 17-Bank Go-Live
SWIFT is taking its biggest step into crypto after confirming its blockchain-based shared ledger is ready for initial use. Built o...

XRP Price Prediction: Judge in XRP Ruling Delivers Fresh Blow
Federal Judge Analisa Torres, the architect of XRP’s landmark 2023 securities ruling, has handed down another closely watched deci...