Bitcoin Price Struggles Above $17K, Why BTC Is Still In Bullish Zone
Bitcoin price extended its rise and traded towards $17,400. BTC is correcting gains, but it remains well supported near the $17,000 zone. Bitcoin extended its increase above the $17,000 and $17,200 resistance levels. The...
Archive context
Older archive item. Useful for background and entity history, but not a fresh market-moving signal.

Bitcoin price extended its rise and traded towards $17,400. BTC is correcting gains, but it remains well supported near the $17,000 zone.
- Bitcoin extended its increase above the $17,000 and $17,200 resistance levels.
- The price is trading above $17,000 and the 100 hourly simple moving average.
- There is a key bullish trend line forming with support near $16,880 on the hourly chart of the BTC/USD pair (data feed from Kraken).
- The pair could rise further if it stays above the $17,000 support and the trend line.
Bitcoin price remained in a positive zone above the $16,800 level. BTC extended its increase after there was a clear close above the $17,000 level and the 100 hourly simple moving average.
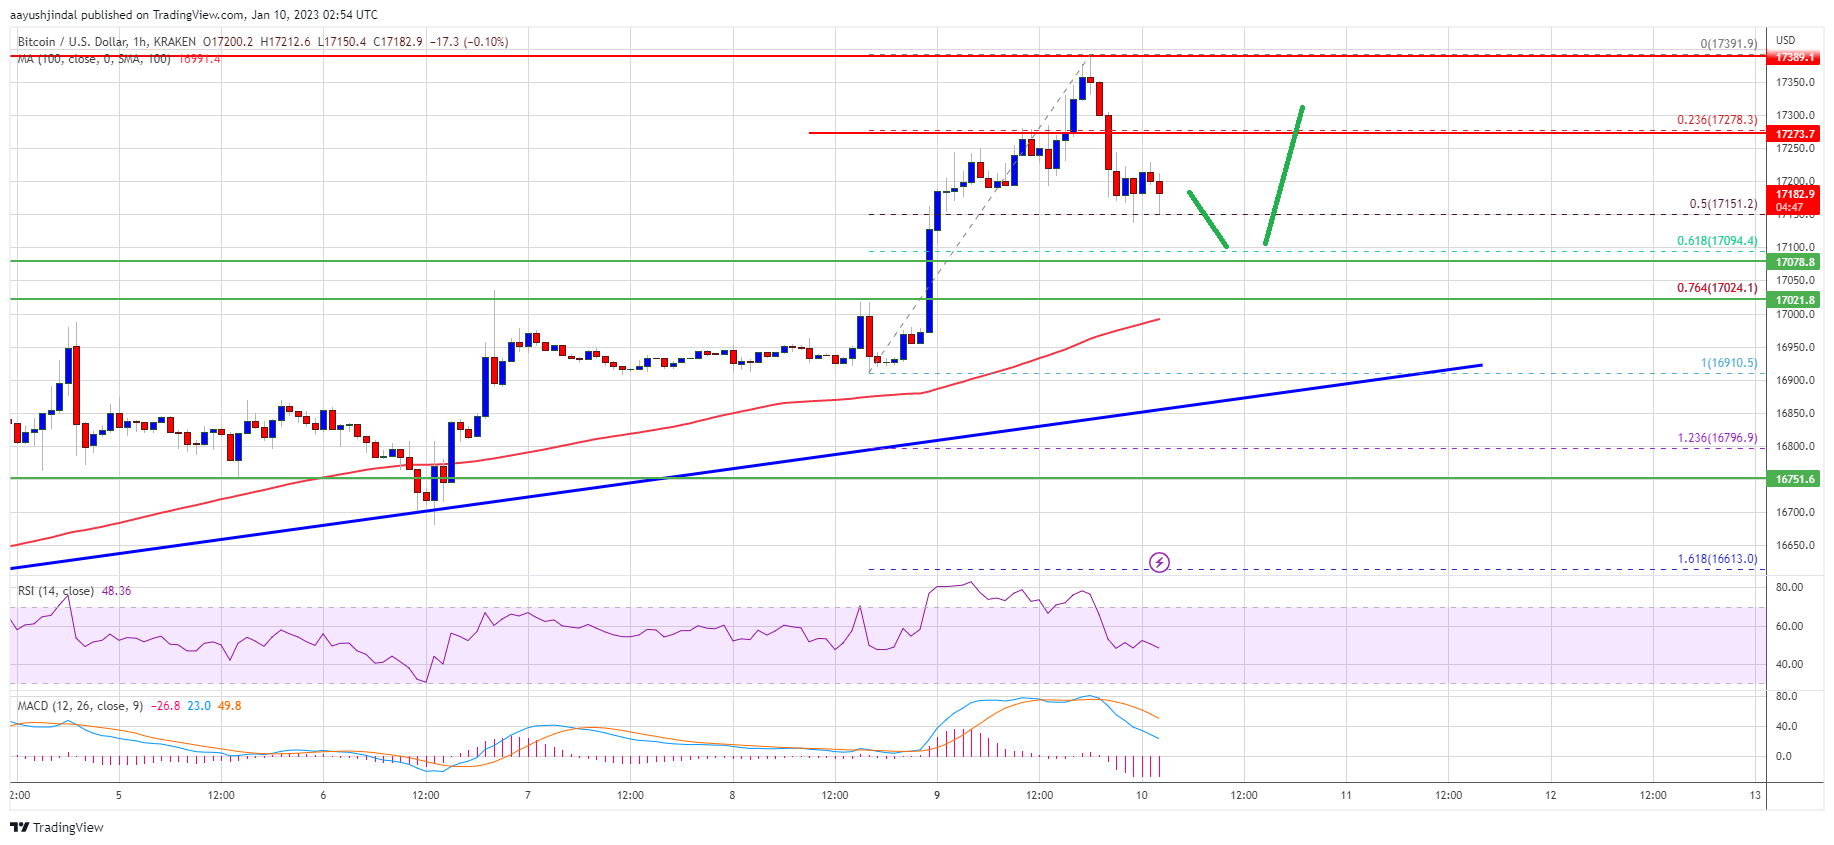
The price gained pace and traded above the $17,250 level. It traded to a new yearly high at $17,391 before the bears appeared. There was a minor downside correction below the $17,250 level. It is now trading near the 50% Fib retracement level of the upward wave from the $16,911 swing low to $17,391 high.
Bitcoin price is now trading above $17,000 and the 100 hourly simple moving average. There is also a key bullish trend line forming with support near $16,880 on the hourly chart of the BTC/USD pair.
Source: BTCUSD on TradingView.com
On the upside, an immediate resistance is near the $17,280 level. The next major resistance is near the $17,400 zone, above which the price might even clear the $17,500 resistance. In the stated case, the price may perhaps rise towards the $18,000 level. Any more gains might send btc price towards the $18,500 level.
Dips Supported in BTC?If bitcoin price fails to clear the $17,300 resistance, it could extend its downside correction. An immediate support on the downside is near the $17,150 level.
The next major support is near the $17,080 level. It is near the 61.8% Fib retracement level of the upward wave from the $16,911 swing low to $17,391 high. The main support is now forming near the $17,000 zone and the trend line region, below which the price might retest $16,500.
Technical indicators:
Hourly MACD – The MACD is now losing pace in the bullish zone.
Hourly RSI (Relative Strength Index) – The RSI for BTC/USD is now above the 50 level.
Major Support Levels – $17,150, followed by $17,000.
Major Resistance Levels – $17,300, $17,400 and $18,000.
Why this matters
This bitcoin story adds another data point to the current market tape and is useful when read alongside nearby source coverage.
Original source
Read on NewsBTCRelated market context

Ethereum (ETH) Price Prediction: ETH Eyes $2,100 as ETF Inflows Return and Whale Demand Builds
Ethereum price is trading near $1,785 after a modest 24-hour recovery, but the market is now watching whether fresh inflows and wh...

XRP Price Prediction: Bears Eye $1 Support as Whale Activity Suddenly Collapses
While Ripple XRP is still holding above the psychologically important $1 level, analysts are closely monitoring whether buyers can...

XRP Price Prediction: Key Metrics Point to a Crash
XRP prediction chatter is heating up even as the price slips, which is usually when markets like to play tricks. XRP trades at aro...

Ethereum Price Prediction: Robinhood Chain Leads Ethereum’s Biggest User Onboarding Wave
Price prediction debates are heating up as Ethereum trades at $1,790 and is slipping in trading volume. Still, Robinhood Chain kee...

Bitcoin Price Prediction: Strategy Has a New BTC Approach
Bitcoin price is trading at $62,900, as we debate whether this pause is simply a reset or something more serious, with bearish pre...

Ripple Crowned: UK Treasury Just Changed Everything for XRP
In the latest XRP news, Ripple Labs has joined the UK HM Treasury’s Wholesale Digital Markets taskforce, a 54-firm initiative that...